

Agriculture industry mapping: Pilot mapping project

Important agricultural land mapping (Mapping) identifies the most productive & highly suitable land for agricultural industries. The Mapping provides information for local, regional and state planning. The mapping will also provide information to industry, agencies and organisations to assist in their decision making.
Pilot Mapping Project
In 2011- 2012, in consultation with government, industry and community stakeholders, the NSW Department of Primary Industries (NSW DPI) investigated a new process for mapping agricultural lands in a pilot mapping project.
This was necessary as previous Agricultural Suitability maps were outdated and largely unsuitable for digitising.
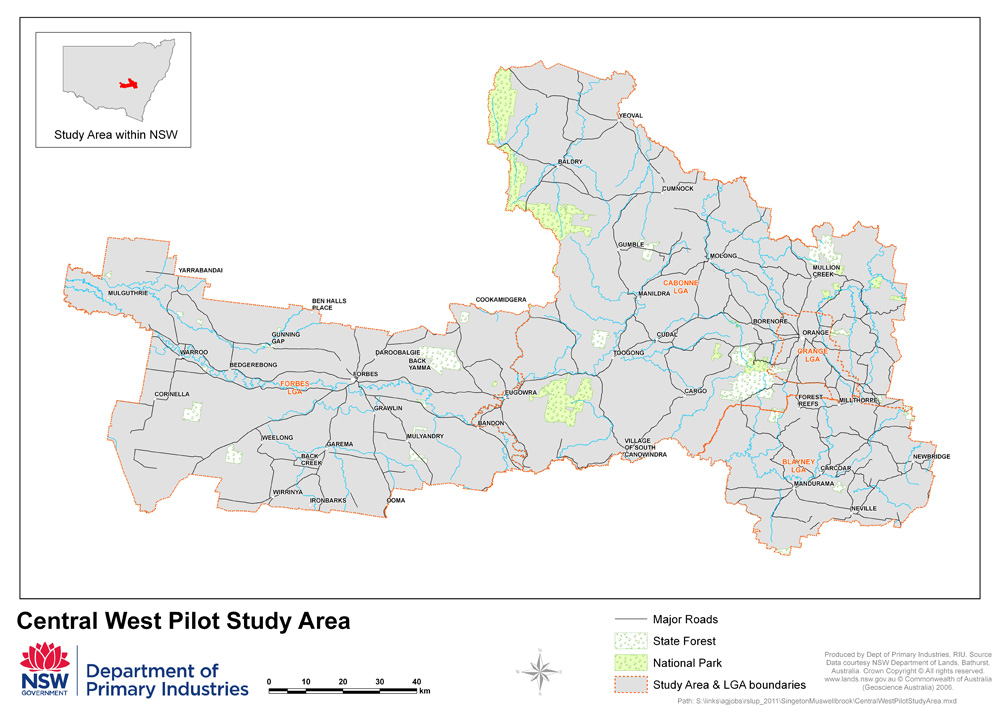
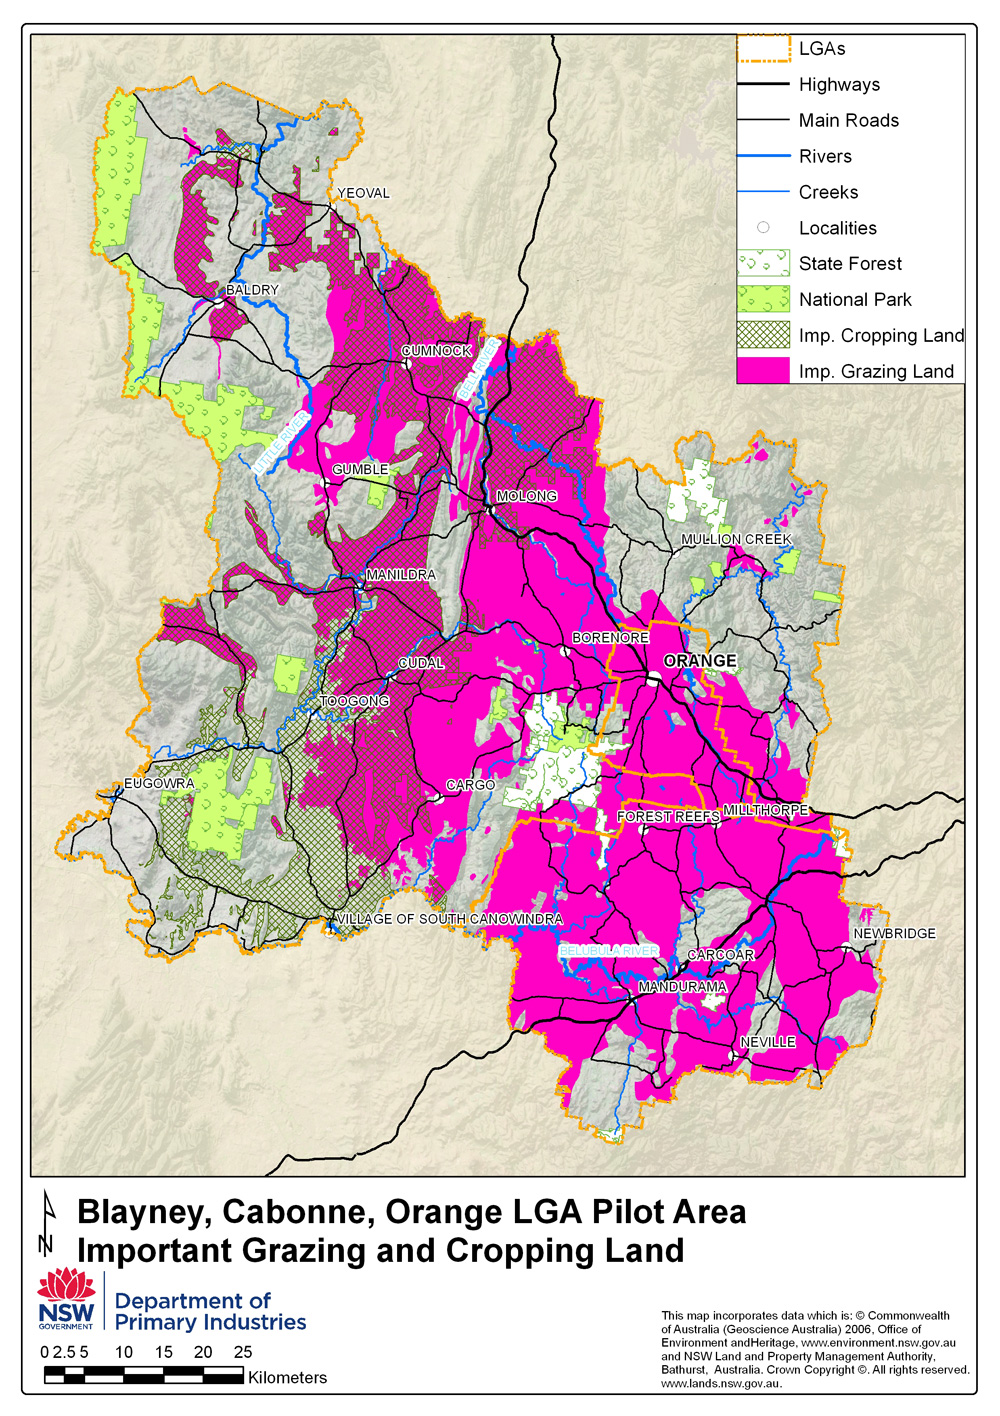
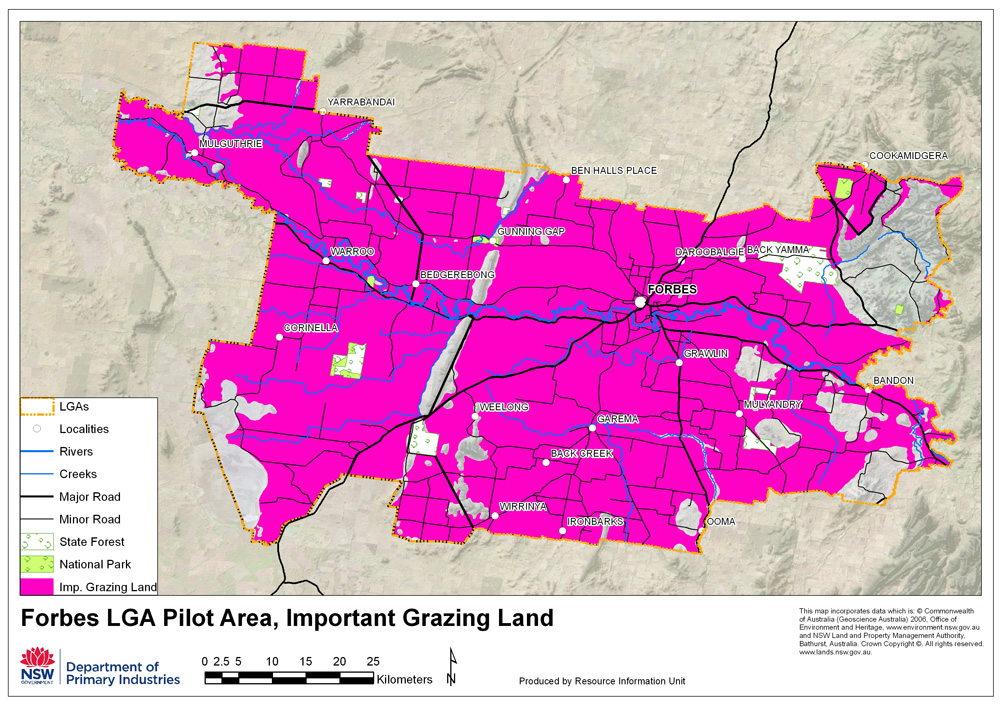
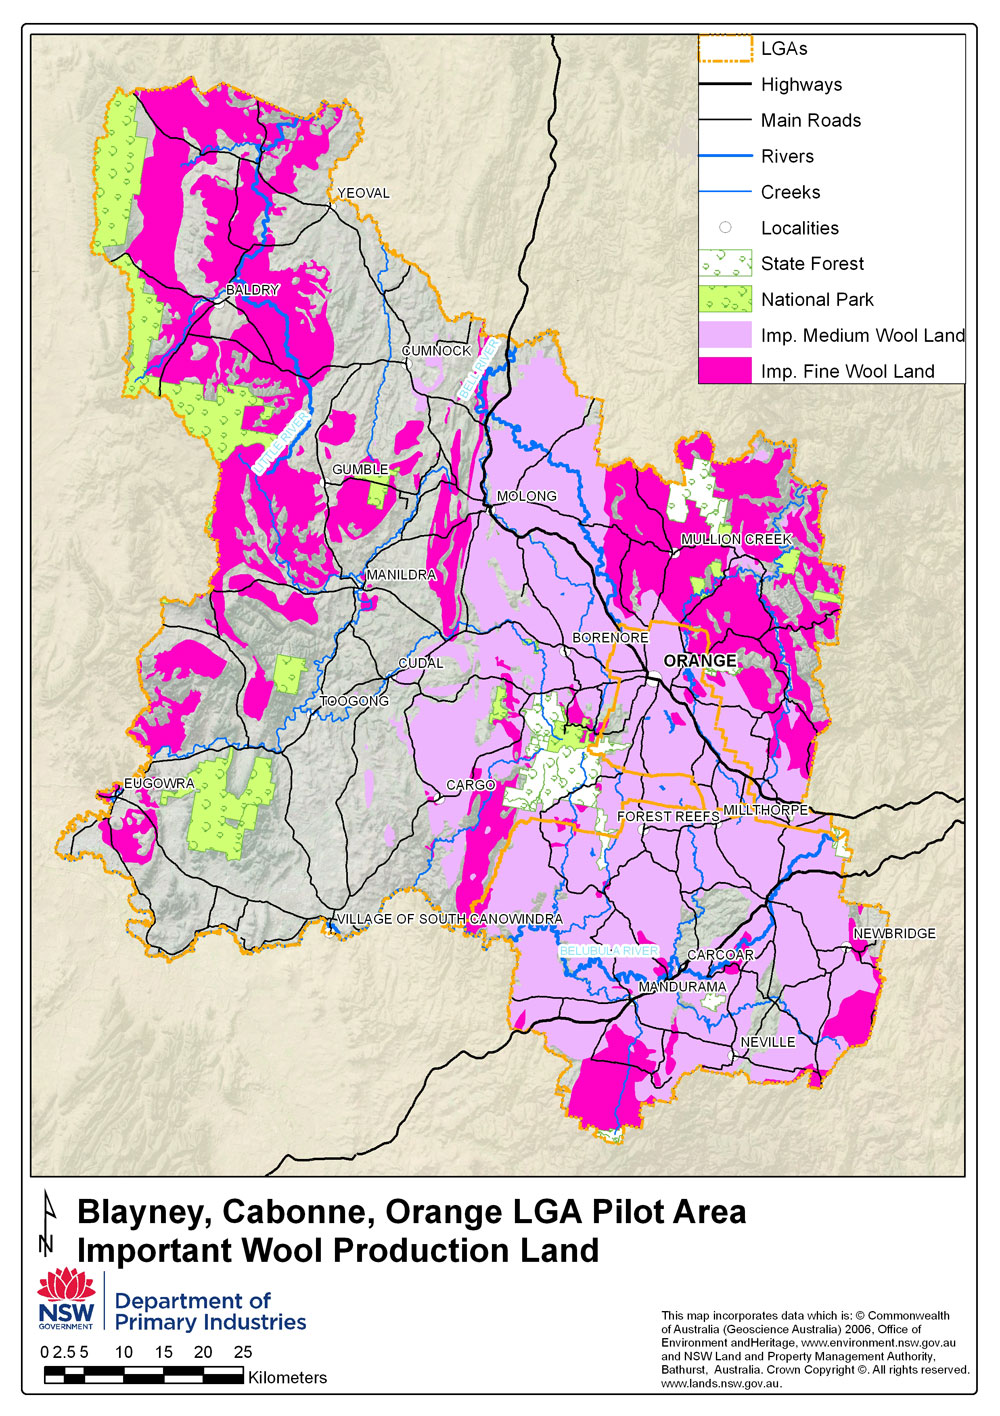
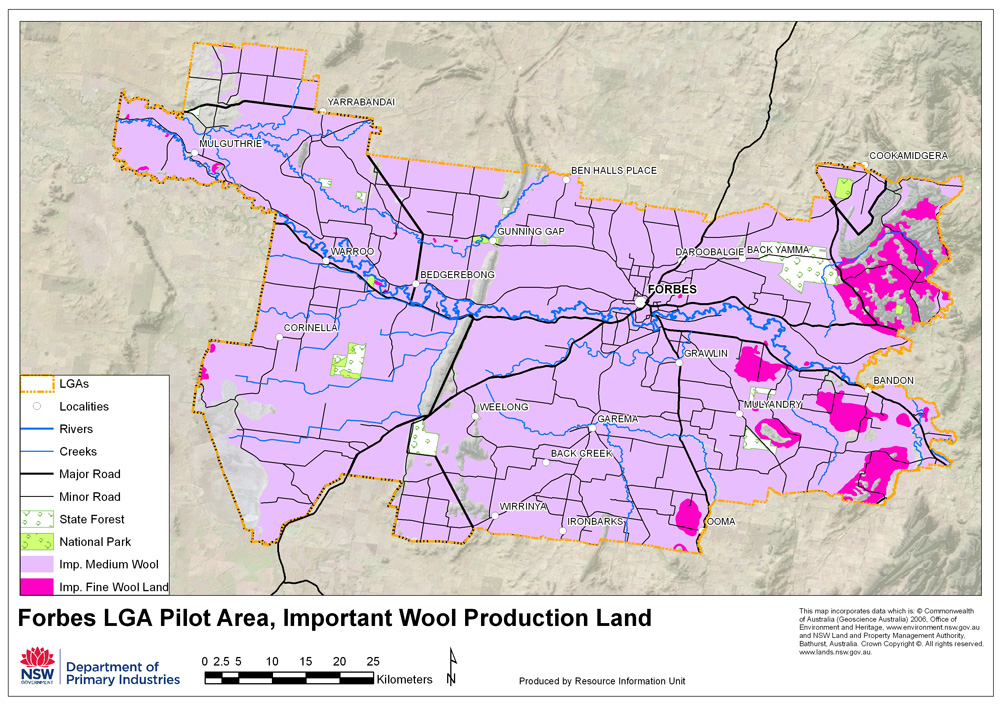
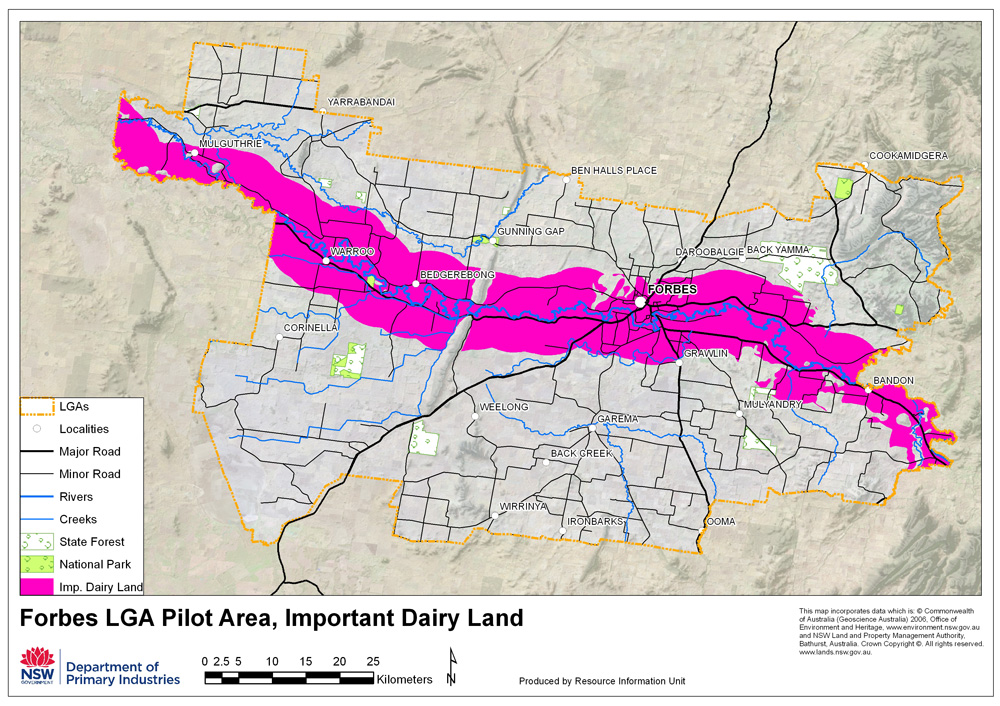
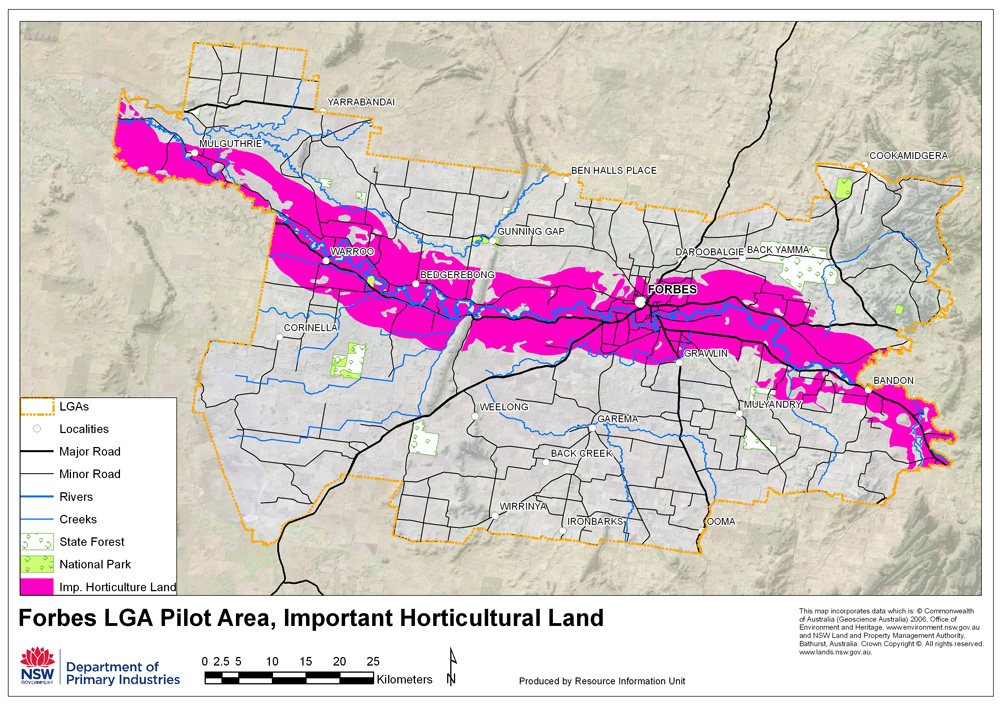
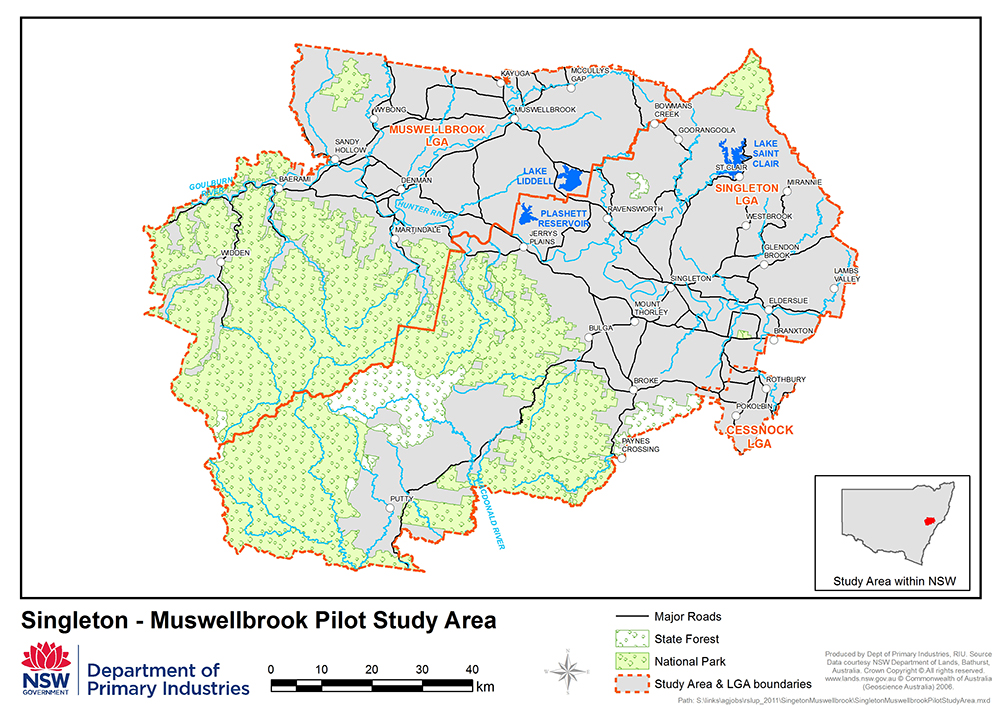
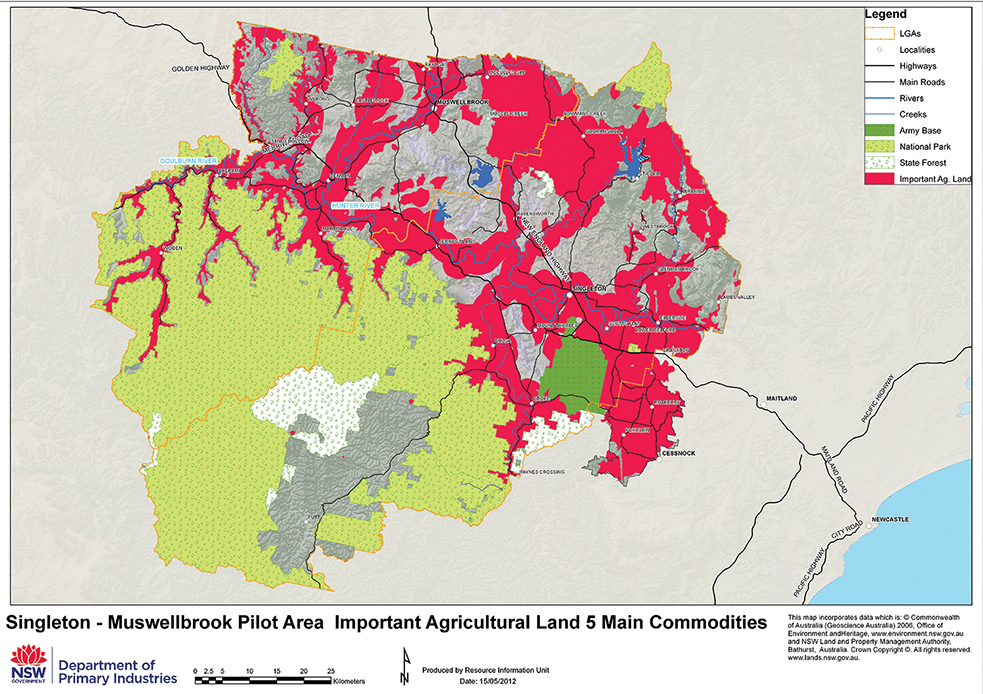
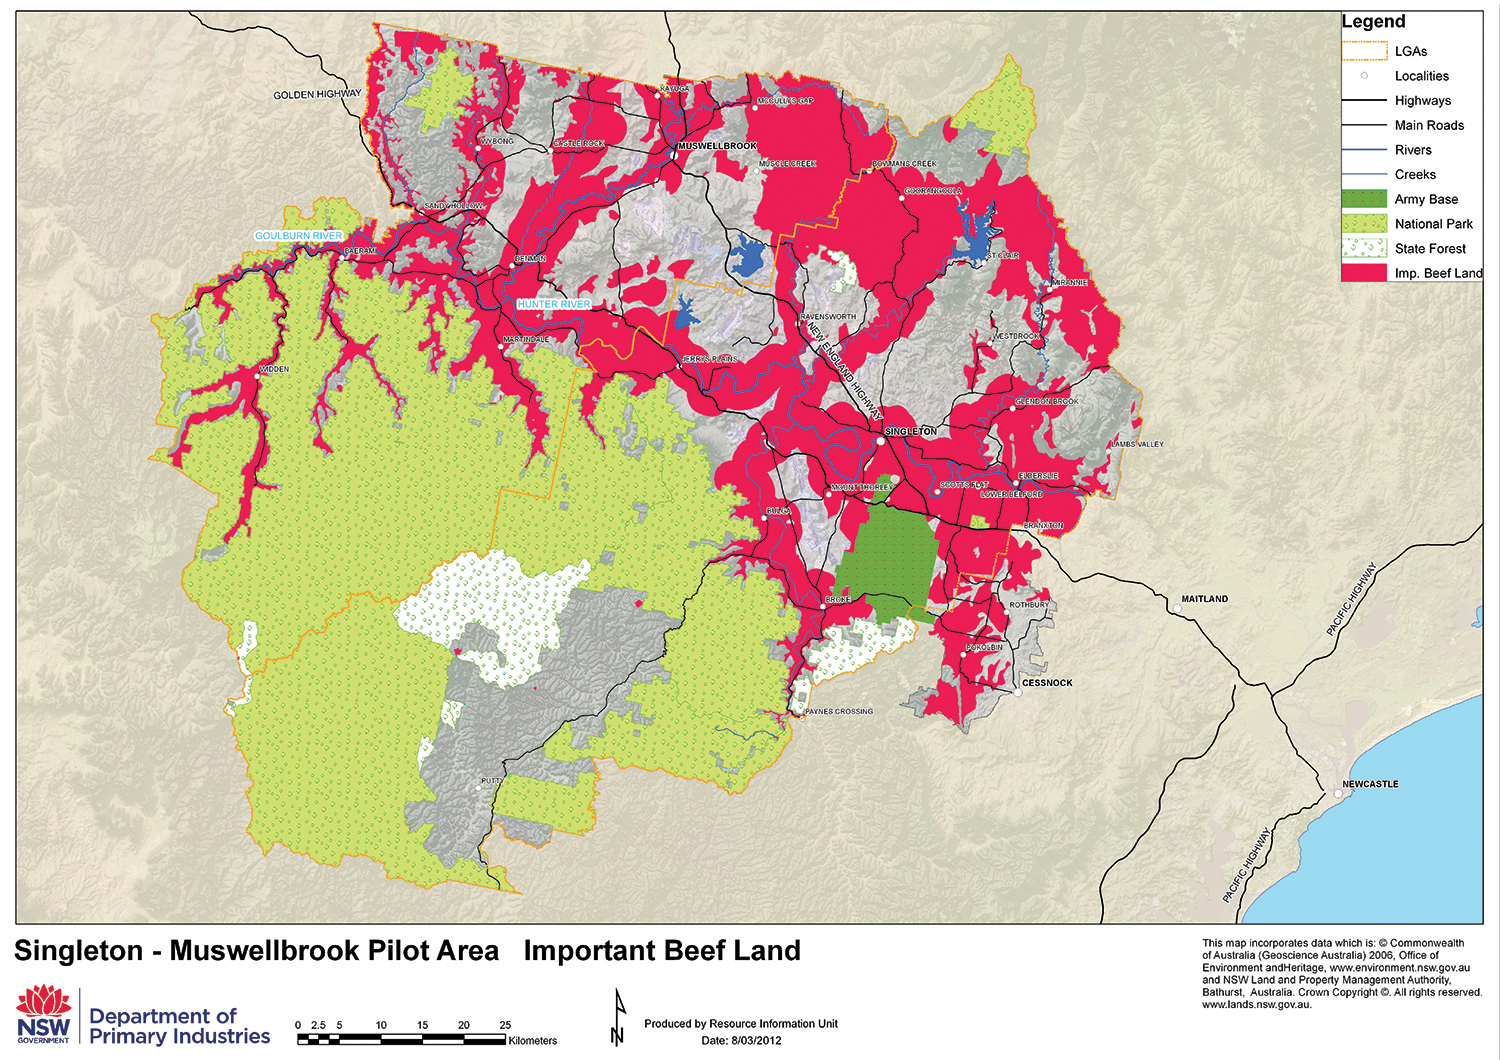
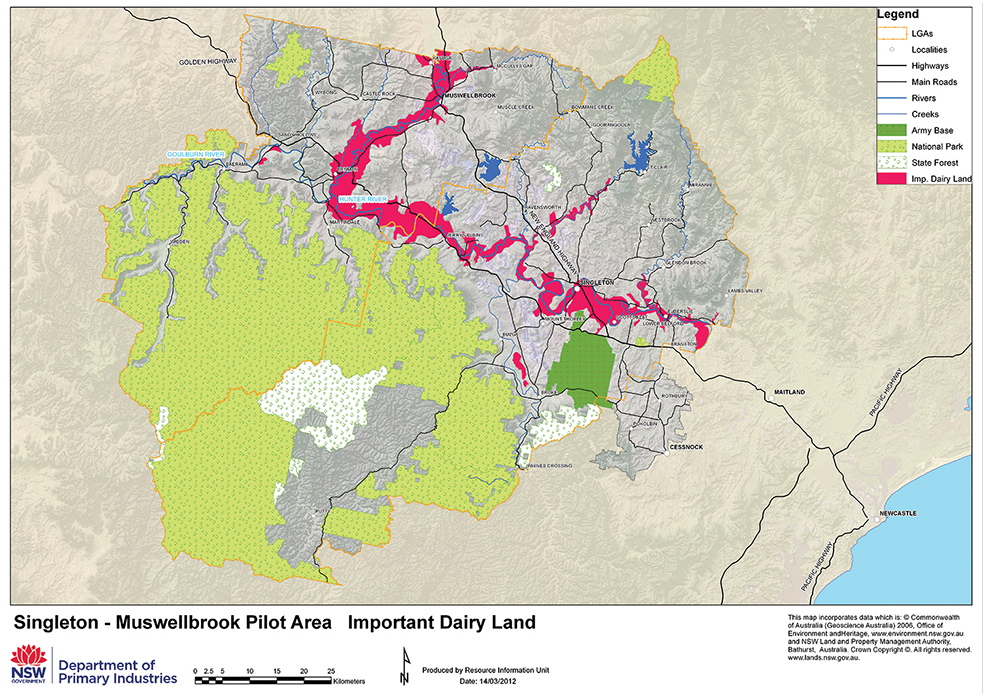
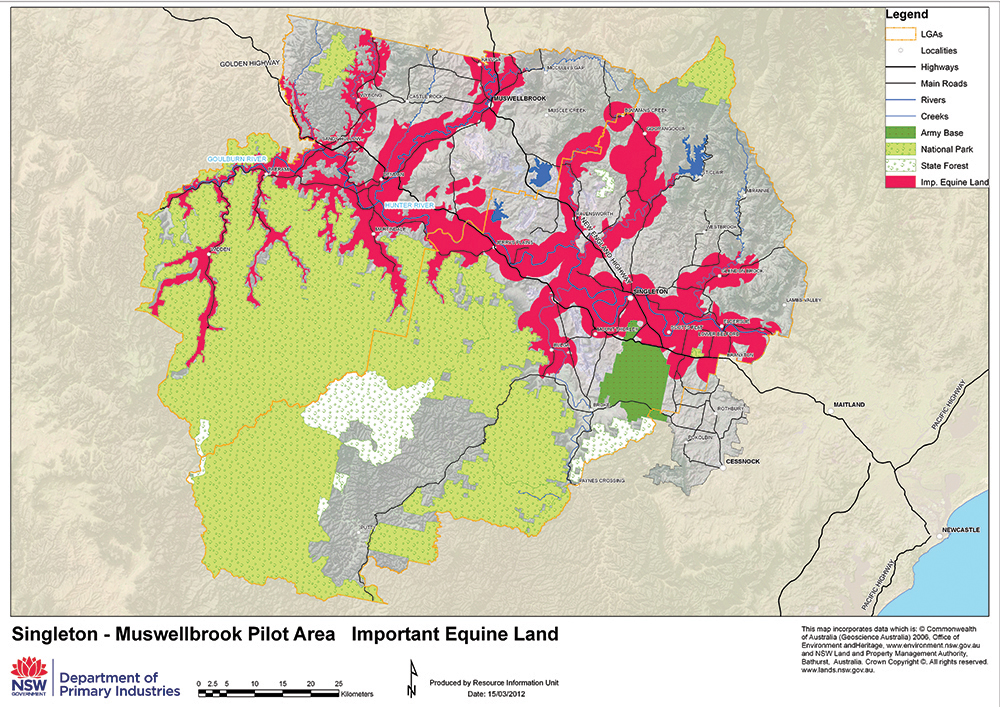
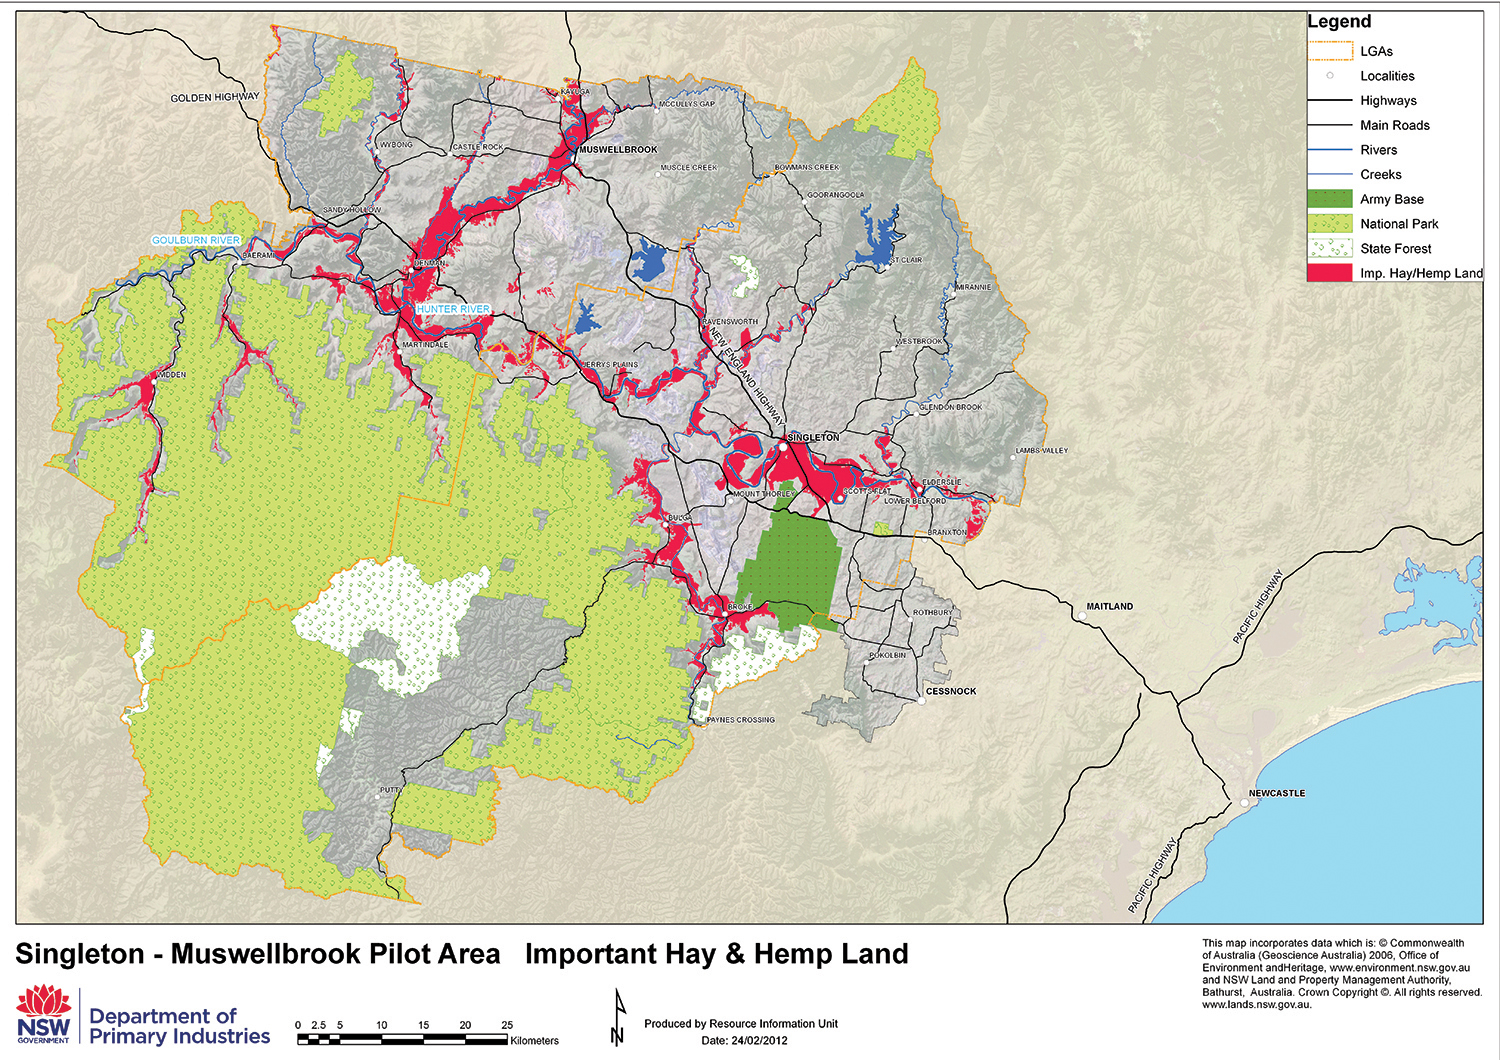
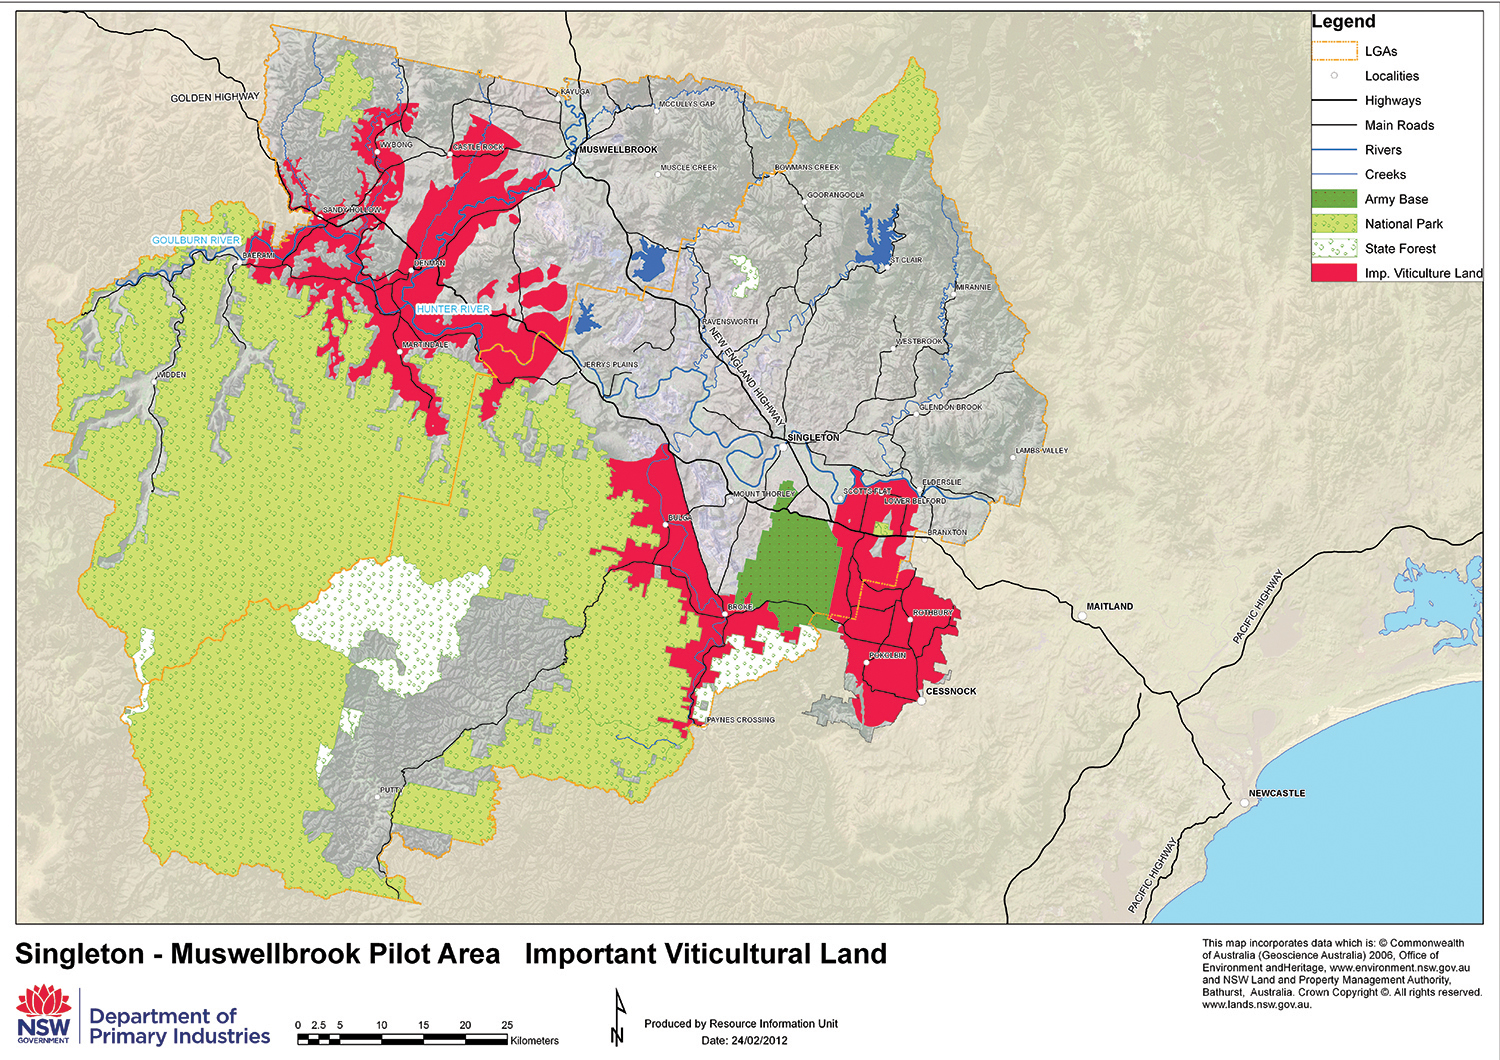
In two case studies (Central West and Upper Hunter) the pilot project mapped highly suitable lands for each leading agricultural industry across six local government areas (LGA's). The six LGA’s were Orange, Blayney, Cabonne and Forbes in the Central West; and Singleton and Muswellbrook in the Upper Hunter. These areas were selected because of their diverse agricultural landscapes and industries.
The Mapping was developed using currently available spatial data sets and were verified at stakeholder workshops. The Mapping is supported by agricultural industry profiles that provide the context for the maps.
Information in the profiles includes:
- critical features of the agricultural industry sector,
- agricultural development potential,
- important resources for that Agricultural industry sector, and
- land use planning implications for agricultural investment
Agricultural industry maps and associated profiles can inform:
- local government strategic land use planning,
- strategies for local / regional economic development strategies,
- industry development strategies, and
- strategies for natural resource investment and catchment management
The following maps and profiles are available for each of the pilot mapping areas:
Central West Region | Orange, Cabonne and | Forbes Shire Map |
|---|---|---|
N/A | ||
N/A | N/A |
| Upper Hunter Region | Singleton & Muswellbrook Shires |
|---|---|
| Viticulture Profile (PDF, 1600.32 KB) | Hay/Hemp Lands (JPG, 1611.05 KB) |
The methodology for the pilot project was documented in "A Pilot Project to Map Important Agricultural Lands: Methodology, Review and Recommendations" prepared in 2012 by the NSW DPI. A guideline to identifying important agricultural lands in NSW was developed from the pilot and is the current guideline for mapping important agricultural lands in NSW.
Constraints when using the maps
Regardless of the scale at which a map is viewed, its precision is determined by the original scale and quality of the data used to create the maps. Expressed as a ratio, the map scale indicates the relationship between a unit of length on a map and the length it represents on the ground.
The scale of the most critical data sets used to map agricultural land is 1:250,000. This means that 1 cm on the map corresponds to 250,000cm or 2.5 km on the ground and 1 square centimetre on the map corresponds to 6.25 square kilometres (625 ha) on the ground.
The smallest area able to be accurately identified from the data is 250 ha. The maps are suitable for strategic planning purposes at a whole local government or regional scale. They are not suitable for property specific planning such as assessing development proposals or spot rezoning proposals. Such proposals may require a far greater level of accuracy and detail on soil, water, vegetation and infrastructure or marketing studies etc that is not available from this mapping data.
The factsheet interpreting important agricultural land maps provides further information on the mapping constraints and application.
A series of development assessment guidelines are available on the Department's Land use planning webpage under Development assessment. Information here is provided to help consent authorities assess the merits of property specific development applications.
Agricultural Mapping in Land Use Planning
The Mapping and the associated profiles can inform the development of local strategic plans by helping planning authorities recognize and value agricultural land, identify land that is most suitable for the LGA's leading and potential agriculture industries.
In particular the Mapping can help councils to make decisions to support sustainable agricultural development and minimise land use conflicts by:
- zoning important agricultural lands under suitable protective primary production zones,
- zoning lands for non-agricultural purposes (such as rural small holdings or environmental protection) not in land identified as important agricultural lands
- adopting supportive planning criteria including; permissible land uses, minimum lot sizes and development control plans.
Locations that are not identified as 'important agricultural lands' in the Mapping may still be agricultural land that can be used for commercial agriculture. This may include agricultural land:
- important for atypical agricultural industry,
- agriculture system that can function at a lower intensity or with lower margins.
- marginal areas (eg climatic) or usually with some constraints or limitations
