

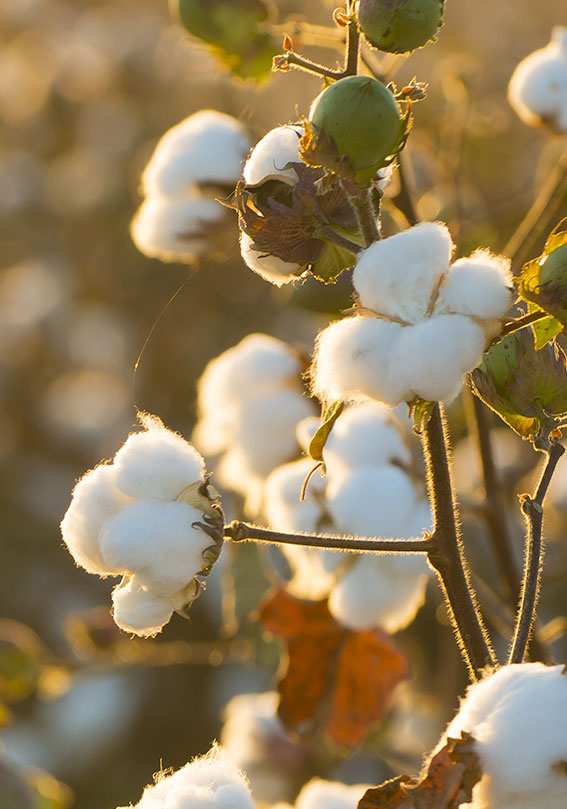
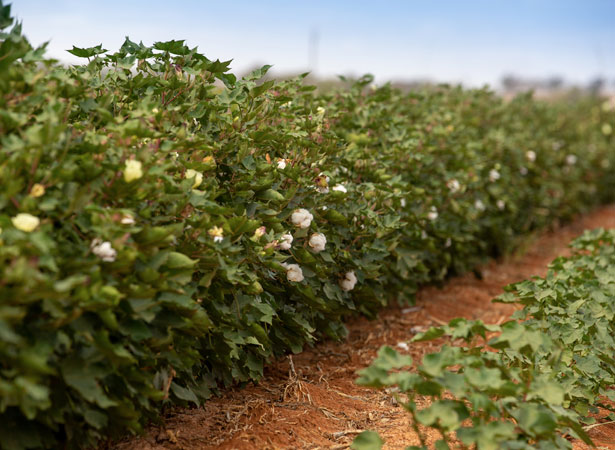
Cotton

cropping
Cotton
-
Output $763m est. Down 53% yoy
-
Production down 56%
-

Value of exports to China, up 98% est
Cotton production more than halved in 2018–19 as poor seasonal conditions, low water allocations and high water prices impacted producers. Output value declined by 53%, with low production slightly offset by stronger prices. The value of exports to China increased by 98%, driven by trade tensions between the US and China.
DPI research harnessing fungus to fight invasive weeds
NSW DPI, in collaboration with Melbourne University, is harnessing a naturally occurring fungus to tackle Noogoora burr, an invasive weed which causes major impacts on agriculture and the environment in eastern Australia. Noogoora burr hosts pest insect species and fungal pathogens which affect cotton, including environmental pests and Verticillium dahliae which causes Verticillium wilt ‐ a major concern for the cotton industry.
Learn More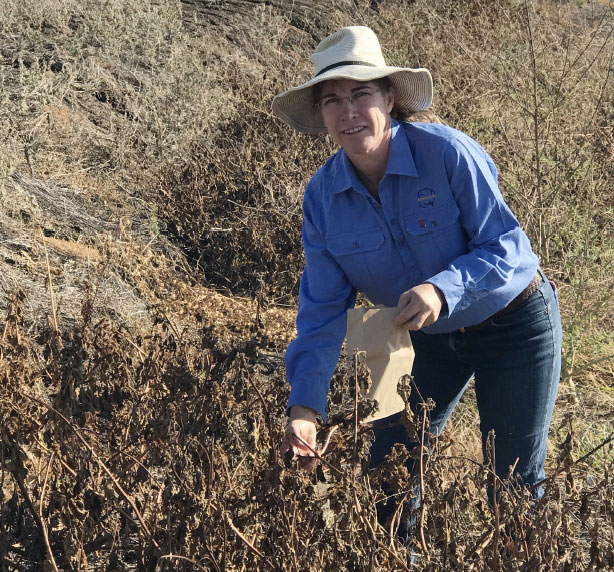
Water productivity benchmark study
NSW DPI, together with industry partners, established a project to collect water use data to track improvement and communicate water use efficiency in the cotton industry. The team used published studies, experiments and surveys, with cotton industry patterns able to be traced back 27 years. Preliminary data shows the cotton industry has been achieving steady improvement in yield with less water over the past 10 years.
Learn More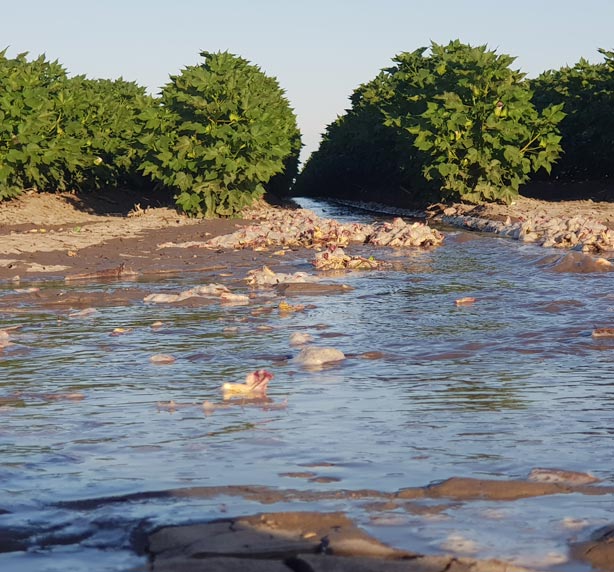
Production
NSW is the main producer of cotton in Australia, growing approximately two thirds of the national crop on average. Production fell by more than half, down 56% year-on-year.
Area planted was down 35% to 227,000 hectares5, 6 as a result of drier and warmer than average seasonal conditions during October and November 2018, the typical window for planting cotton. These conditions were compounded by low water allocations and soaring water prices.
Yields dropped by 37% year-on-year and were 33% lower than the Australian average due to low water availability and little follow-up rain to carry the crop through in some regions. Irrigated cotton crop yields ranged from 7 to 14 bales per hectare and as much as one-fifth of dryland crops in Northern NSW were ploughed in from lack of water11.

Area planted vs production
- Area planted
- Production
Download (.XLSX) Source: ABARES (2019b)
Price
The global Cotton A index fell 21%, driven by projected higher stocks outside of China, a tough demand outlook for US cotton exports as a result of US-China trade tensions and strong competition from synthetic fibres122, 143.
While international prices faced 32-month lows, Australian prices were resilient and reached high levels. Prices were supported by a depreciated Australian dollar and strong demand from traditional export markets, particularly China6, 122, 100.
Global consumption outweighed supply with world stocks at continued low levels of approximately 80 million bales. Lower global production from the previous year coupled with higher consumption were the primary drivers140.
Global supply and demand
- Closing stock ex China
- Closing stock China
- Production
- Consumption
Fibre price indexes
- Spun cotton yarn
- Spun synthetic yarn
- Cotton A Index
Trade
NSW export data was not available due to confidentiality restrictions. As in 2017–18, from a national perspective China was Australia’s largest market (the majority of the export market share for ‘unidentified country’ in the chart below is assumed to be attributable to China). The value of Australia’s exports to China (combined with an unidentified market) increased 98% year-on-year, driven by China’s falling reserves and trade tensions87.
Exports to all key markets (except Indonesia and China) declined as China procured the lion’s share. Whilst the Vietnamese market declined by 18% this year, Australian cotton exports to Vietnam have increased by more than 200% over the past five years, becoming Australia’s second largest export market and the third largest global importer of cotton in 2018-19140, 117.
Australian cotton export markets
Circle size denotes export value
Download (.XLSX) Source: GTA (2019)
Australian exports to China and Vietnam
- China & Unidentified Country
- Vietnam
- China and Vietnam combined share
Macroeconomic Conditions
Australia was China’s largest supplier of cotton with approximately 26% market share in 2018–19143. As trade tensions between the US and China escalated and China applied retaliatory tariffs of 25% against US cotton, opportunities arose for Australia to supply more to China. There were expectations of a US-China truce within Australia’s cotton export window but this did not occur100. The chAFTA also eliminated the 15% tariff on cotton seeds for Australian producers23.
The decline in global cotton prices has made cotton more competitive and more affordable to the ever increasing number of middle class consumers from developing economies. However, consumption is expected to slow down as global economic growth slows5, 122.
Outlook
In the short term, global production is expected to increase as a result of favourable seasonal conditions. Higher global stock levels, competition from other fibres and greater global demand uncertainty will put downward pressure on cotton prices6.
Domestically, with water storages at their lowest levels since records began, the cotton industry will face pressures from low availability of irrigated water and increased competition from other irrigated commodities such as almonds6, 99, 101.
