

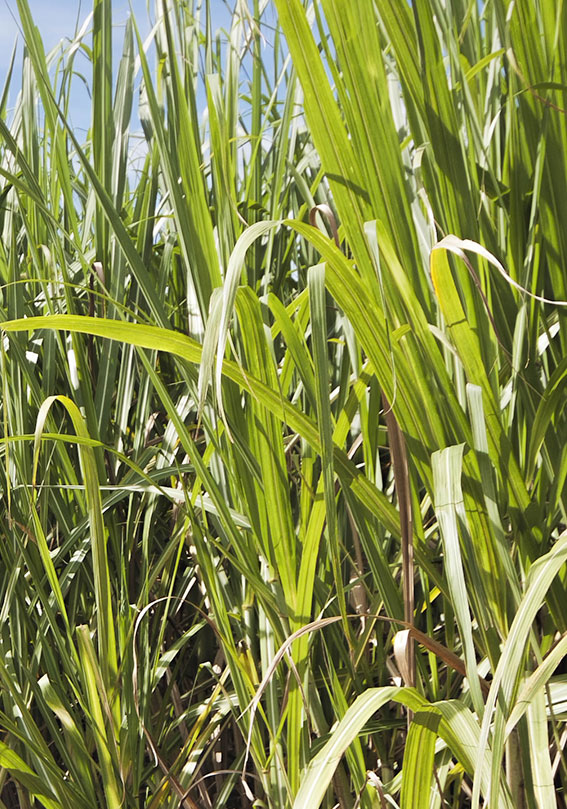
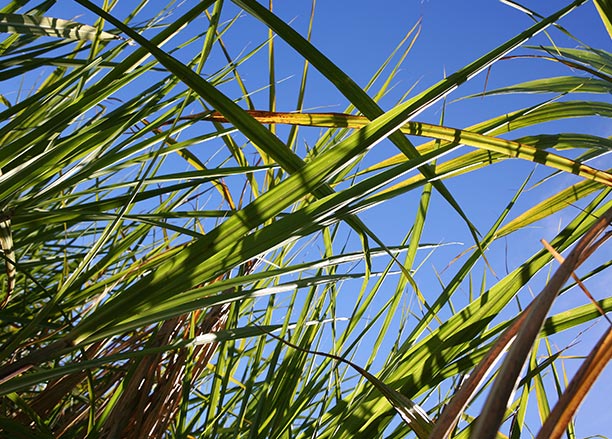
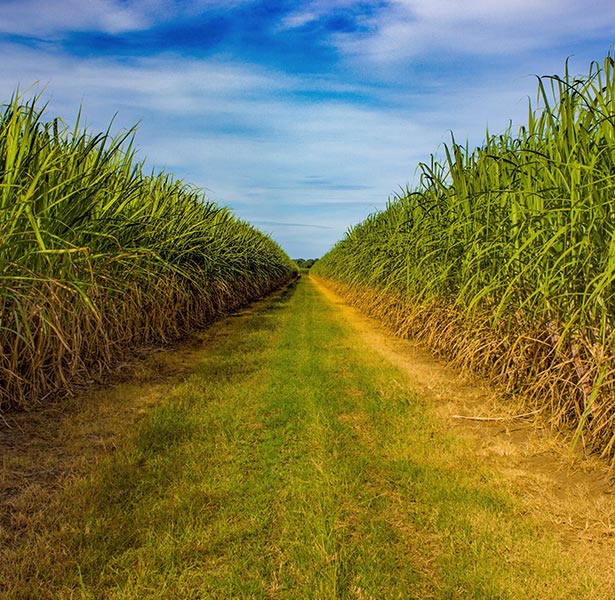
Sugarcane

cropping
Sugarcane
-
Output $80m est. Down 6% yoy
-
Production increased by 7% yoy
-

Prices reached 10-year low
Although NSW producers coped relatively well with the adverse weather conditions, the industry faced a tough year with global sugar oversupply putting a dent in industry revenue.
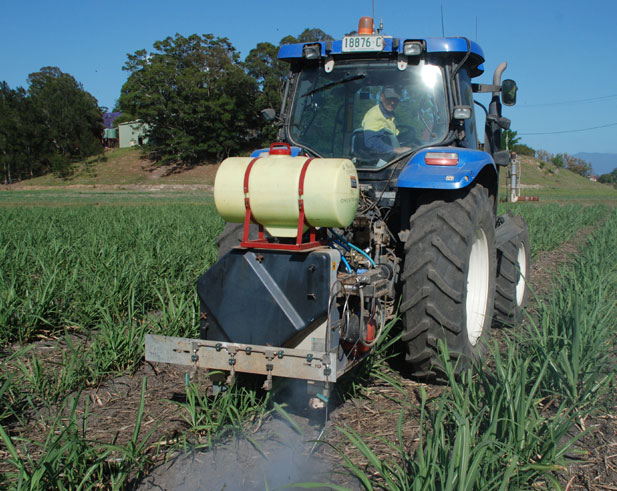
Collaboration on nitrogen use efficiency
NSW DPI, in partnership with Southern Cross University and Sunshine Sugar, assessed nitrogen stores in 32 soils of sub-tropical sugarcane in North East NSW to improve understanding of nitrogen supplied from mineralisation. This research informs the development of decision support tools for growers to evaluate the potential production and product impacts of using certain enhanced efficiency fertilisers in the context of the individual farm system.
Sugarcane yield 2018
- Yield
- Change year-on-year
Sugar content 2018
- Percentage CCS
- Change year-on-year
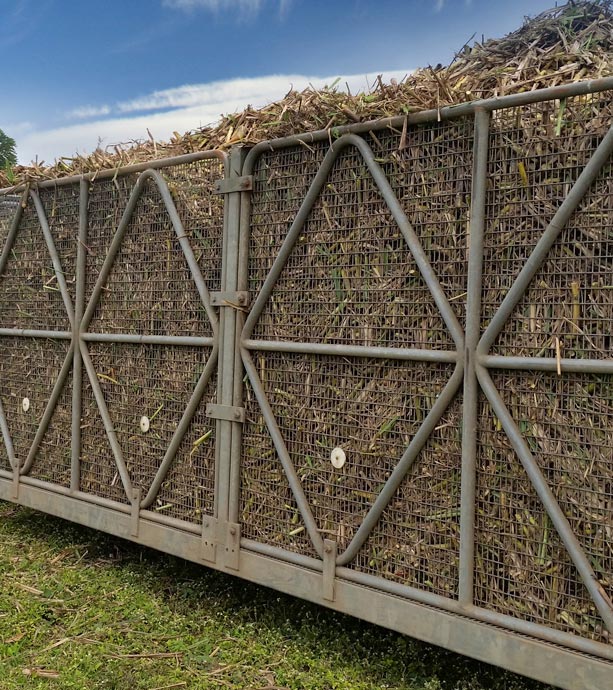
Production
Production fared well despite seasonal conditions characterised by drought and severe frost.
The area harvested was up 4% on the previous year to 16,208 hectares, resulting in a crush of 2 million tonnes, up 7% year-on-year and equivalent to 6% of Australia’s total sugarcane33. Production reached 245,674 tonnes IPS, an increase of 9% over the previous year33. One positive outcome from the dry conditions was that it helped lift national Commercial Cane Sugar content by 8% from 13.3 to 14.3 units121.
The NSW season falls across financial years with harvest generally commencing in June. This means that production for the 2018–19 financial year consists mostly of the 2018 harvest and a small part of the 2019 harvest. The 2018 season was hit by severe frost in some parts of northern NSW, which resulted in a higher percentage of one year cane being harvested, up by 5% from the previous year134.
NSW yields increased by 4%, reaching 125 tonnes of cane per hectare. However, the national average declined by 4%33, with extreme weather (including dry conditions followed by cyclones and flooding) in Queensland, the largest producer of sugar in Australia121.
Price
Record-level global closing stocks in 2017–18 saw prices continue their downward slide, slumping to 10-year lows in late 2018 before they recovered slightly during early 2019121, 92, 133. As Australia accounts for less than 3% of global sugar production, it is traditionally a price taker in the global market92.
Global supply, demand, balance and futures price
- Global surplus/deficit
- Price
Download (.XLSX) Sources: USDA (2019i); MACRO (2019)

Trade
Exports of sugarcane increased by 21% year-on-year to approximately $1.9 million87. Papua New Guinea (35% market share) and New Zealand (19%) were the two most valuable export destinations at $679,000 and $359,000 respectively. The weak Australian dollar supported export demand for NSW sugar.
Macroeconomic
Conditions
Many countries including India, Thailand, the US, the EU and China, continue to receive government support and maintain protectionist policies for their domestic sugar industries. This has distorted the market and led to the global oversupply of sugar5.
Recent years have seen the allocation of sugarcane to ethanol production in Brazil, formerly the largest producer of sugar (India is currently number one). High oil prices and decarbonisation energy policies provided sugar mills with incentives to produce ethanol rather than sugar. As a result, Brazil’s 2018–19 sugar production dropped by 24%. This has taken some pressure off rising global closing stocks and depressed prices5, 150.
Human consumption of sugar remained relatively constant for the 2018–19 year, up by 0.2% to 174 million tonnes150.
Australia, Brazil and Guatemala have lodged complaints with the World Trade Organization’s Dispute Settlement Board against India’s sugar subsidies. Brazil claimed the Indian government has distorted global sugar markets by doubling the minimum price for sugarcane since the 2010–11 season, resulting in Indian sugar exports soaring from 2 million tonnes to 5 million tonnes in 2018–19130.
Outlook
The short to medium outlook for the sugar industry is dependent on global stock levels and production. Global stocks are expected to decrease which will reduce downward pressure on prices.
Protectionist policies will continue to distort the market, however if energy prices continue to support ethanol production, this will help buffer prices as a large portion of Brazil’s potential sugar production will be taken out of the market130.
Human consumption is anticipated to grow across developing nations and the Asian region which, when combined with the projected weak Australian dollar, will help drive demand for NSW sugar92, 124.
