

Sheep Enterprises improve further in 2016
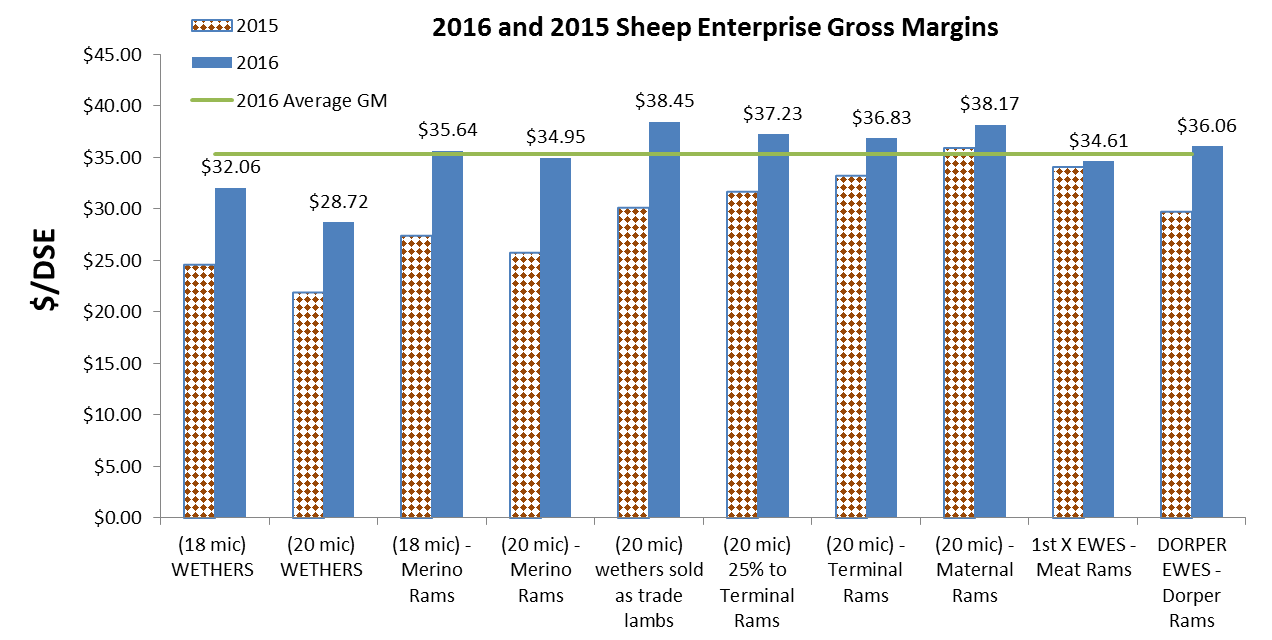
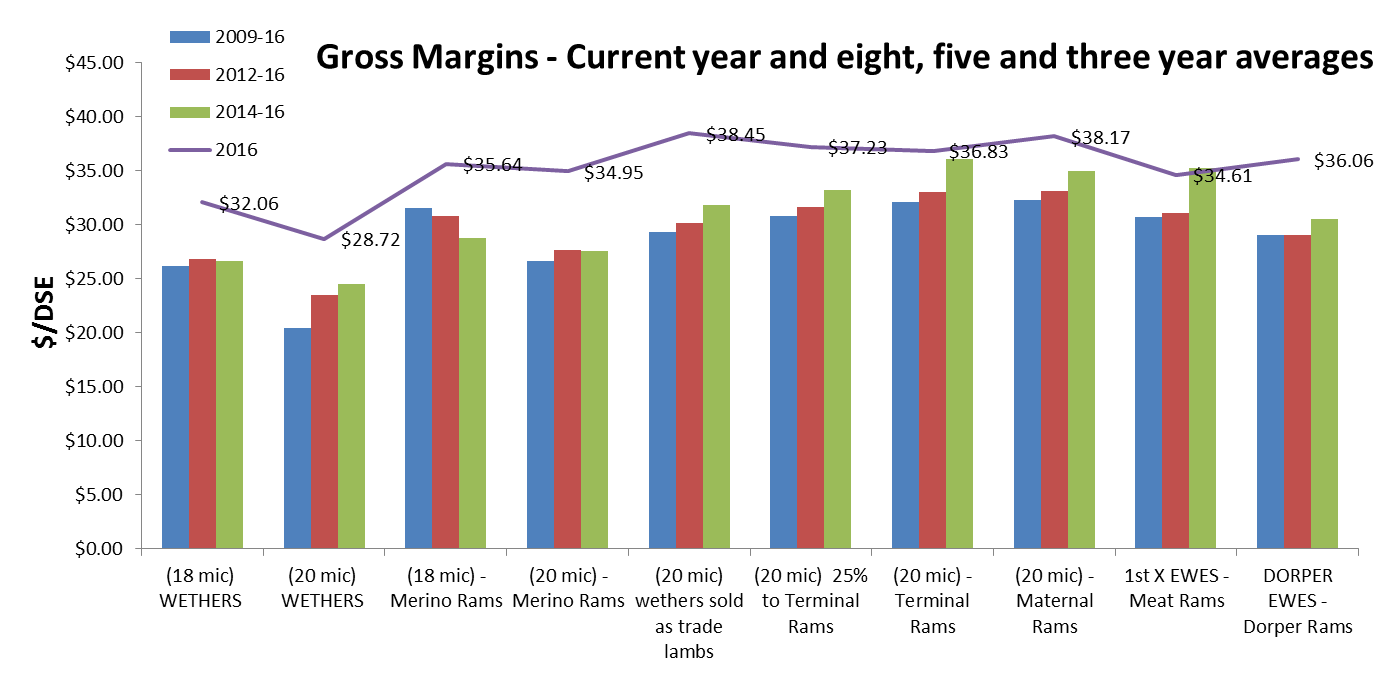
All sheep enterprise gross margins (GMS) have improved on last year with the greatest increases occurring in the wool focussed Merino enterprises, where GMs are up by as much as $9 per DSE (Figure 1).
Of the 10 sheep enterprise GMs analysed, NSW DPI found the 20 micron Merino self-replacing enterprise selling trade Merino wether lambs, and the enterprise joining 20 micron ewes to maternal rams, had the highest GM this year at $38.45/DSE and $38.17/DSE respectively.
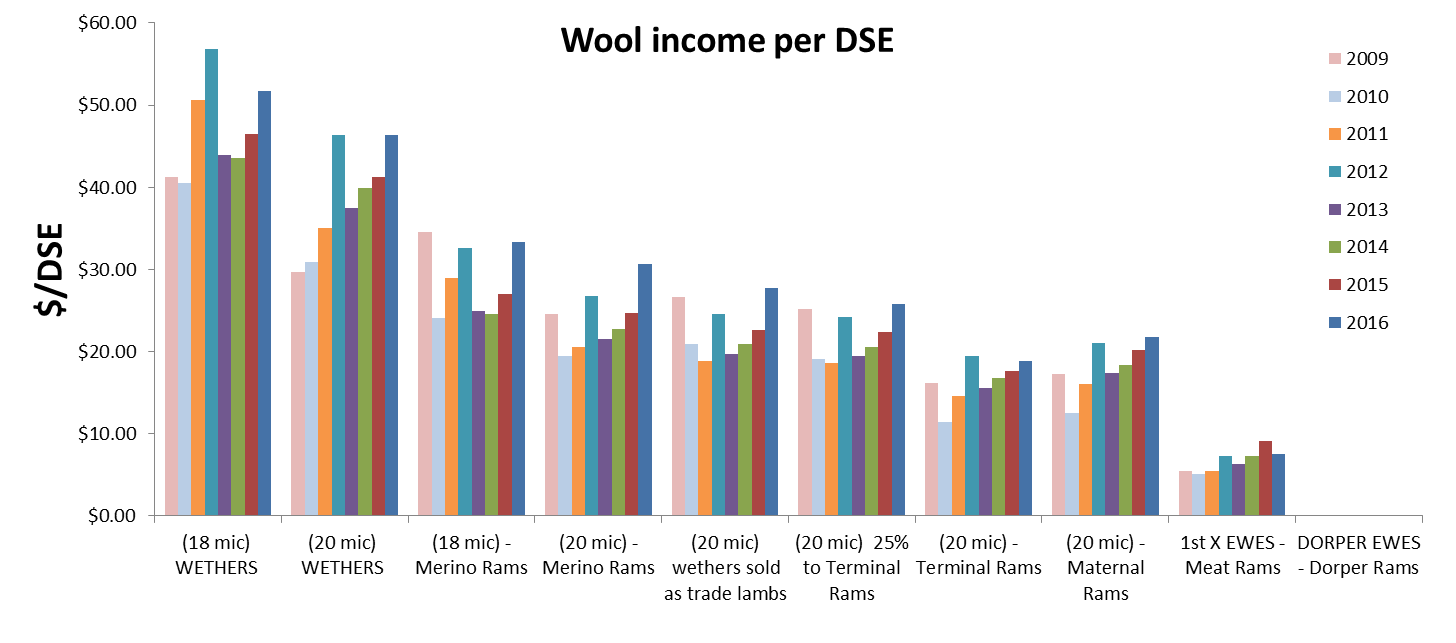
Over the last four years, wool incomes have steadily increased to the point where, in 2016, wool income is close to or greater than the highs experienced in 2011 and 2012.
In reality all breeding enterprises are performing equally well as the range from highest to lowest is small, around $3.50/DSE.
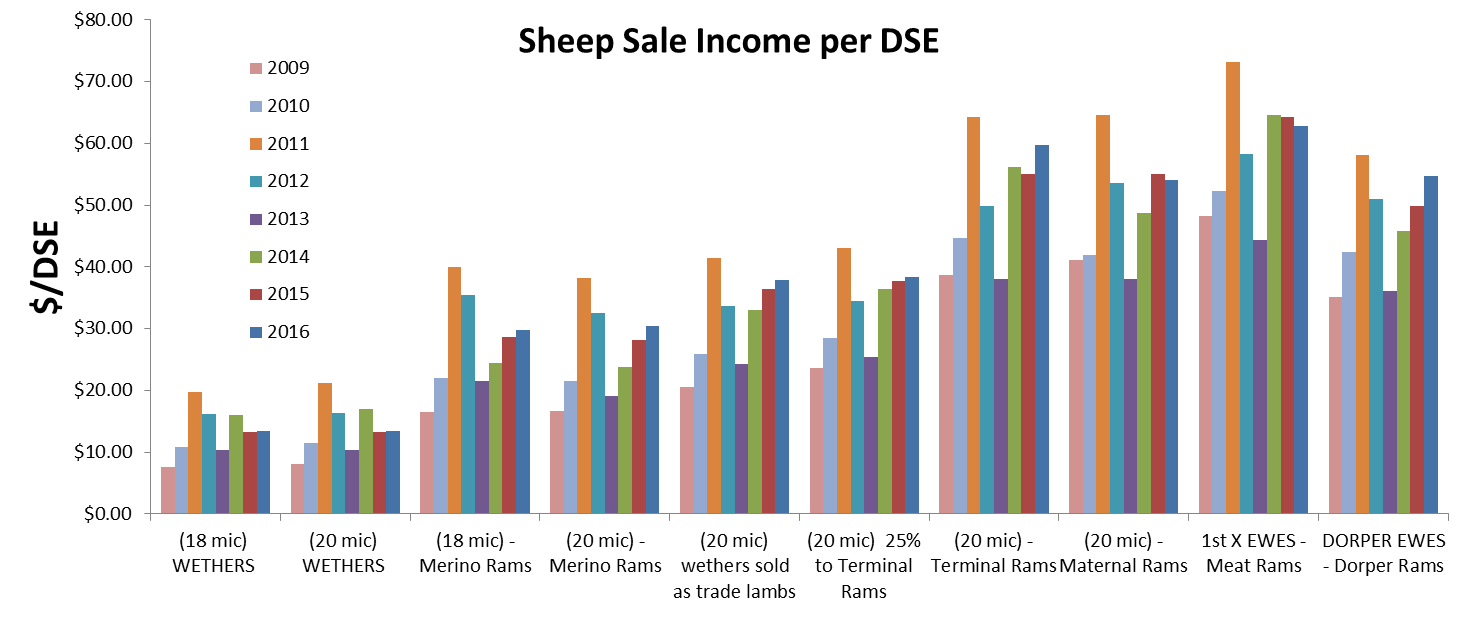
The high value of sheep meat and the strong demand for breeding ewes has provided the backbone for the strong performance of sheep enterprises generally.
The increasing trend in wool value further increases confidence in the sheep industry while also reducing reliance on income generated from sale of lamb and surplus ewes.
Figure 1
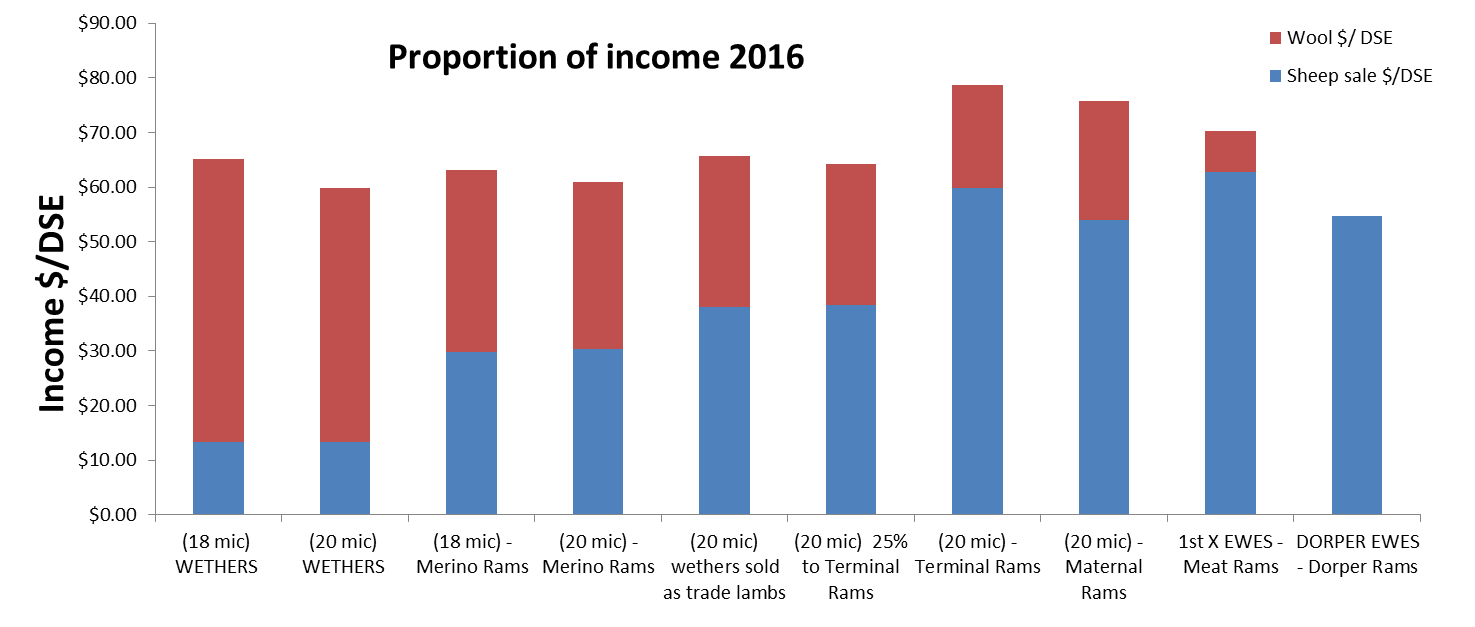
It is not surprising that higher wool values are the main reason for the large jump in performance of Merino based enterprises. For the 2016 year, wool made up nearly 80% of income for wether enterprises and 53% and 51% for 18 and 20 micron ewes joined to Merinos (Figure 2).
These enterprises have also benefited from higher meat values and lower grain prices, while the self-replacing Merino enterprises also benefited from higher surplus ewe values.
Figure 2
However lower crossbred wool values combined with higher replacement ewe costs reduced the gains in GMs for 1st and 2nd cross lamb production where ewes are 100% joined to terminal or maternal rams.
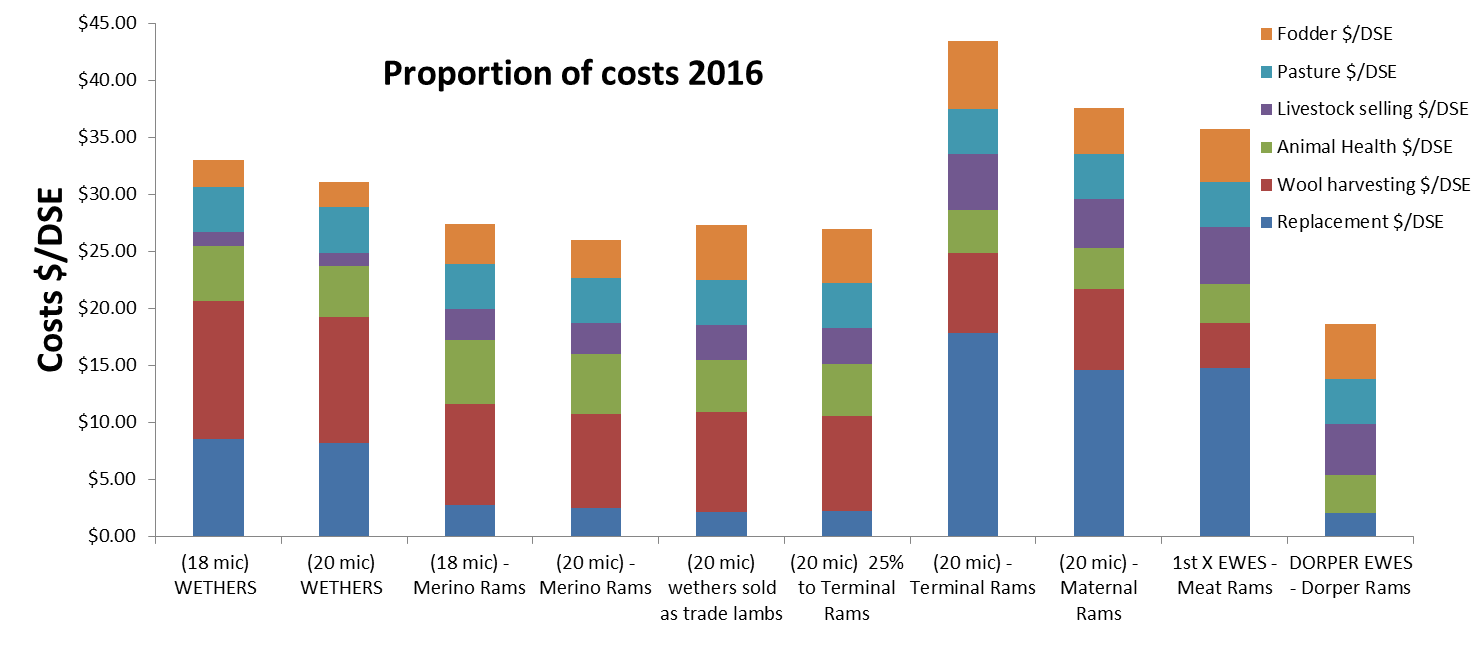
The cost of replacement animals makes up around 20 and 40% of all costs for wether and non-self-replacing breeding enterprises respectively (figure 3).
Another large cost is wool harvesting, which makes up around 36%, 32% and 18% of costs for wether, Merino self-replacing, and meat focused enterprises respectively.
Of interest is the self-replacing Dorper enterprise which has the lowest overall costs with no wool harvesting, minimal replacement (rams only) and the lowest animal health costs.
Figure 3
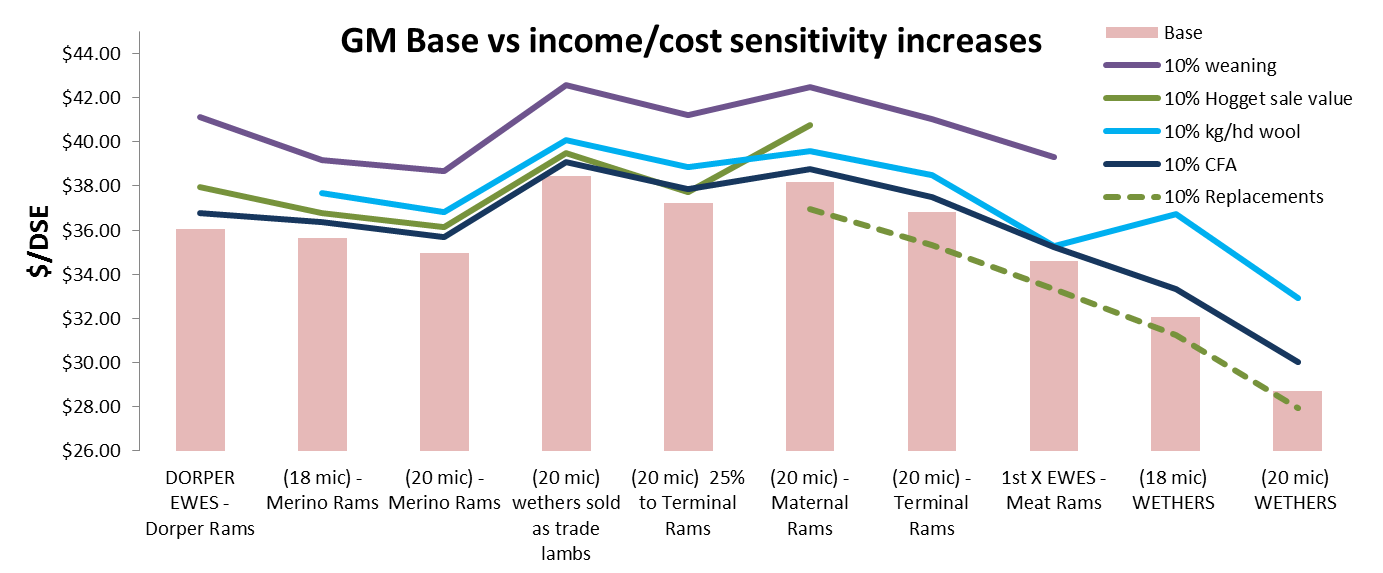
Each enterprise performs differently with changes in price and production variables. The variable with the largest impact is weaning rate. For example an increase of 10% in weaning rate (where there is no increase in costs to achieve it) results in about a 10% increase in GM for enterprises that breed their replacements and 14% for those purchasing replacements (Figure 4).
For wool focused enterprises, a 10% increase in wool cut results in an approximate GM increase of 15% for the wether enterprises, and around 5% for Merino ewe based enterprises.
The value of breeding ewes has remained high due to the strong performance of sheep enterprises generally increasing the demand for sheep. This is good for those enterprises that have surplus ewes to sell and for the Merino enterprise breeding 1st cross ewes. However it is not so good for those having to buy in replacement ewes.
This situation is a little bittersweet for the 20 micron 1st cross ewe breeding enterprise: on the one hand they need to purchase 220 replacements each year, while on the other they benefit from selling 429 1st cross ewe hoggets.
In this instance, a 10% increase in the cost of replacement ewe results in a 4% reduction in GM, while a 10% increase in the value of 1st cross ewe hoggets results in a 7% increase in GM, producing an overall benefit of 3%.
For the other enterprises, in the case of breeding surplus ewes, the gain ranges from around 1 to 5% and for those having to buy in replacements it ranges from minus 2 to 3%.
Note the small impact that a 10% increase in the sale value of ‘cast for age’ animals (CFA) has on all enterprises.
Figure 4
While not shown here, a 25% increase in the cost of grain has relatively small impacts over all enterprises, with the largest being 4% for the Merino enterprise joined 100% to terminals down to 1.5% for 1st cross ewes joined to meat rams.
All enterprises in 2016, except those joined to 100% terminal meat rams, have performed well above their average over the long, medium and short term (8, 5 and 3 year periods). (Figure 5).
Figure 5
The increasing value of sheep meat and the strong demand for surplus breeding ewes has provided the backbone to the strong performance of sheep enterprises generally.
Figure 6
Over the last four years, wool incomes have steadily increased to the point where, in 2016, wool income is close to or greater than the highs experienced in 2011 and 2012 (Figure 7).
The upward trends provide further confidence in the sheep industry, this generally being due to higher returns and less reliance on income generated from selling lamb and hogget ewes.
Figure 7
Note that, to improve the accuracy of the GMs and thus better reflect reality, there have, over the last 8 years, been slight changes in flock structure and the assumptions used. These changes are small and have minimal impact on GM comparisons over time.
GMs only take into account variable costs directly associated with the enterprise and do not take into account capital costs, such as machinery or livestock inventories.
Visit Livestock gross margin budgets to access the full gross margin outputs.
Each GM is calculated with and without typical supplementary feeding costs as well as displaying a range of sensitivity tables allowing the user to see the impact on GMs resulting from changes to key production, income and cost indicators.
