

NSW State Seasonal Update - August 2018
Prepared by NSW DPI Climate Unit
Drought Status
Drought conditions continue to be experienced across NSW with close to 100%* of the state in one of the three drought categories. The latest estimate of drought intensity at the end of August 2018 places up to 30% of the state as Drought Affected, 54% in Drought and 16% in Intense Drought. There has been a notable shift in the amount of NSW that has transitioned from Drought Affected to the Drought category, and the proportion of NSW in Intense Drought remains relatively consistent.
There are a number of Local Land Services (LLS) regions that are currently experiencing the most severe category of Intense Drought. These regions are currently experiencing a more acute rainfall deficit as measured by climate monitoring stations. However it is important to remember that poor agronomic conditions are being experiences across a much wider area of the state.
* Figures are rounded to the nearest whole number as per the standard convention. The actual figure is 99.8%.
Situation Update
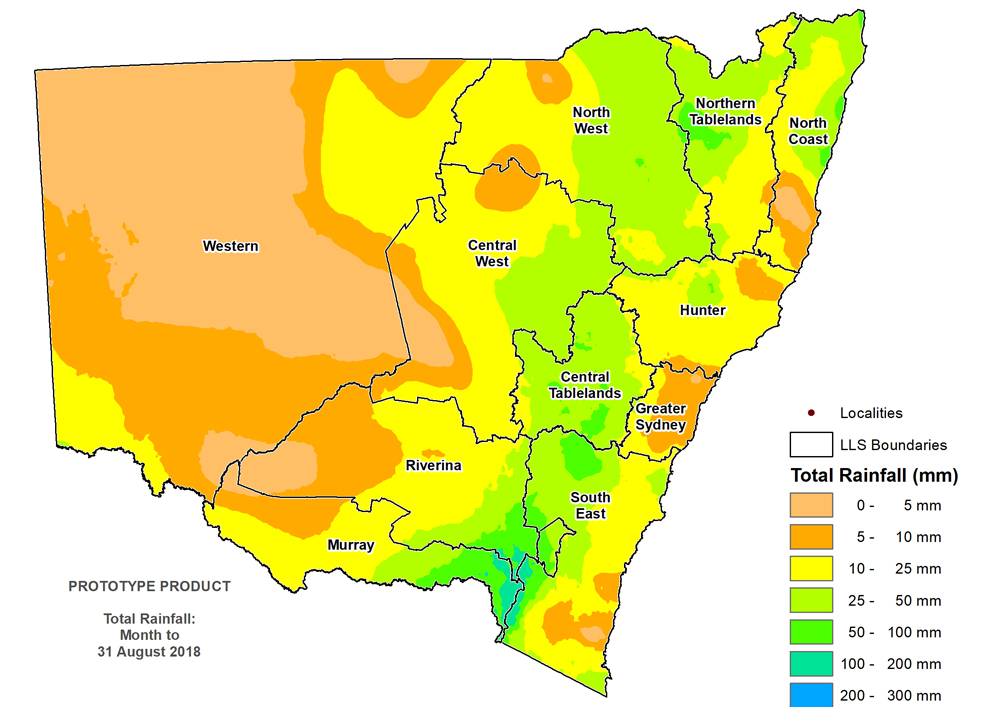
Significant rainfall occurred in August 2018 for parts of the Northern Tablelands, North Coast, Central West, Central Tablelands and a small area of the Western region around Bourke. Reasonable falls were also recorded to the north of the South East region, and in the east of the Murray and Riverina regions. The Hunter region, north of Singleton, also received reasonable rainfall over the month.
This places these areas on a far more positive footing with some recovery of stock and domestic water. With warmer temperatures in late winter and early spring, pastures and crops will respond positively over the coming weeks.
While recent rainfall is positive, it does not constitute a major break from drought. Agricultural recovery takes some months once rain has fallen, and it’s important that land is managed conservatively while returning to a productive state. Follow up rainfall in September would see a recovery strengthening in these regions, but they currently remain in a Drought or Drought Affected state for now.
The Southern Alpine Region experienced very high rainfall in late August 2018, which is promising for the state’s irrigation water and hydroelectricity reserves. While this is a very positive sign for agriculture and water resource management in the south of NSW, authorities continue to closely monitor the situation heading into spring and summer during which time evaporative loss increases.
Parts of the state also had minimal rainfall compared to the rest of NSW throughout August 2018, with Intense Drought and Drought conditions continuing.
Areas of ongoing concern include much of the Western District including Broken Hill and Cobar, the west of the Central West region including Parkes, Condobolin, Nyngan and Coonamble, and the region around Walgett and the North West region. Rainfall was highly variable in the Hunter and it appears that the area south of Singleton had minimal rainfall. These areas have been managing drought conditions for some time, with the event duration now near, or in some cases, over twelve months.
While August rainfall has provided a more positive outlook for field conditions in some regions, it is important to continue to monitor the situation for follow up rainfall in the coming spring.
Climate Outlook
The official forecast from the Bureau of Meteorology currently indicates that there is an increased chance of warm, dry conditions for the next three months (as of 30 August 2018). If the forecasted conditions eventuates we would see an increased intensification of drought conditions across NSW.

It is important to recognise the CDI provides an aggregated view of the State, and that on-ground conditions can be different to those displayed in the maps. They provide an ‘on average’ view of a particular region only. To report local conditions use DPI Farm Tracker.
Rainfall
Rainfall totals were average to very much below average across most of NSW. Rainfall totals in the alpine zone of NSW received falls of up to 150mm. Falls ranged from 0-75mm across the rest of NSW, with the highest falls extending along a north-south transect across central NSW. Western parts of NSW received the lowest falls during August
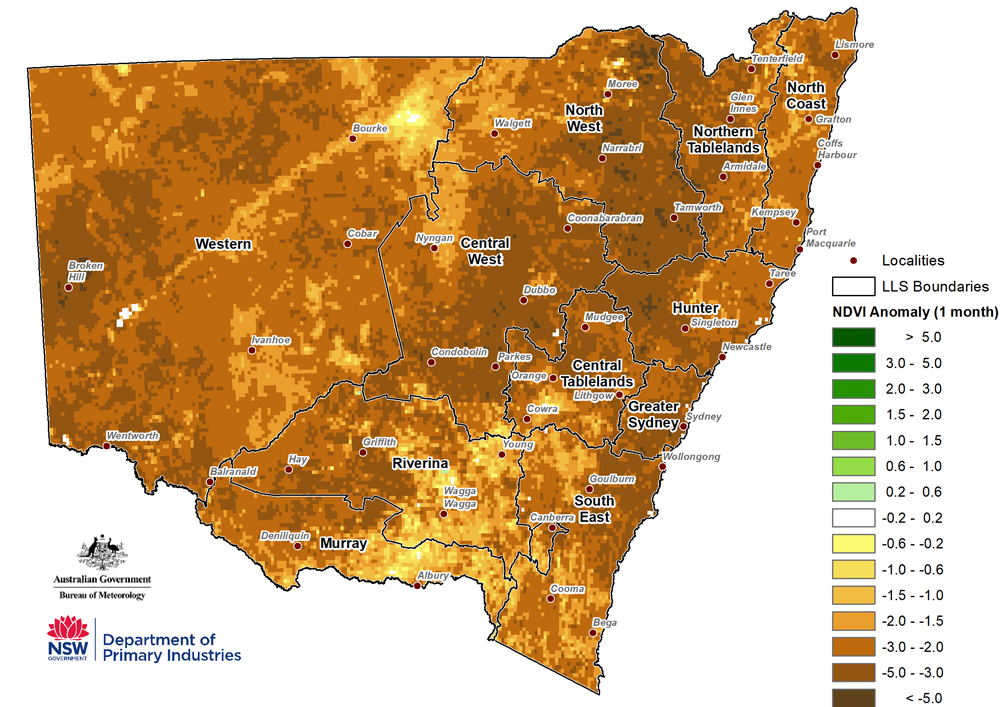
Normalised Difference Vegetation Index (NDVI) Anomaly
The monthly NDVI anomaly (Figure 3) indicates lower than normal greenness extended across NSW during August. Some areas in NSW have seen a slight improvement in the NDVI anomaly this month, due to the rainfall in late August.
The NDVI anomaly data confirms that plant conditions remain poor compared to what is expected at the end of winter, and that there are isolated pockets where there has been a weak-to-moderate improvement in plant growth.
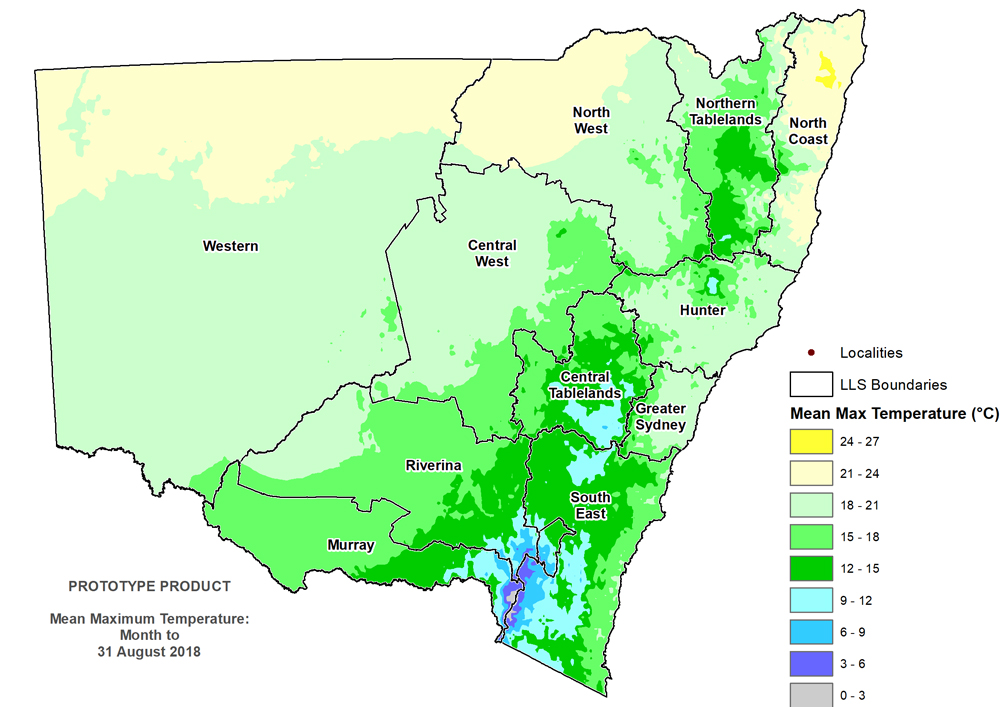
Temperature
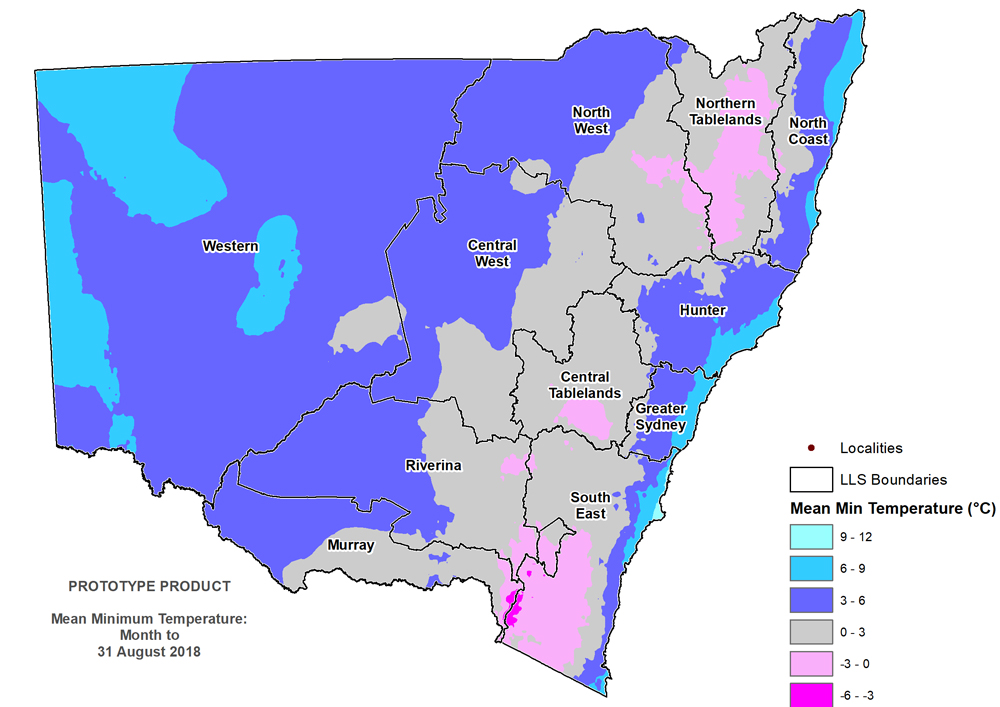
Most of NSW experienced average daytime temperatures between 15 -24°C (Figure 4). Parts of the Central Tablelands South East, Hunter, Riverina and Murray Local Land Services regions recorded average daytime temperatures between 9-15°C and alpine regions recorded daytime temperatures between 0-9°C. Overnight temperatures ranged between 0-12°C across most of NSW, with alpine regions, Central Tablelands and Northern Tablelands averaging between -6- 0°C (Figure 5). According to the Bureau of Meteorology, maximum temperatures were 1.17 °C above average for New South Wales in August, the warmest since 2013.
Extreme events
There are no extreme events to report in August 2018.
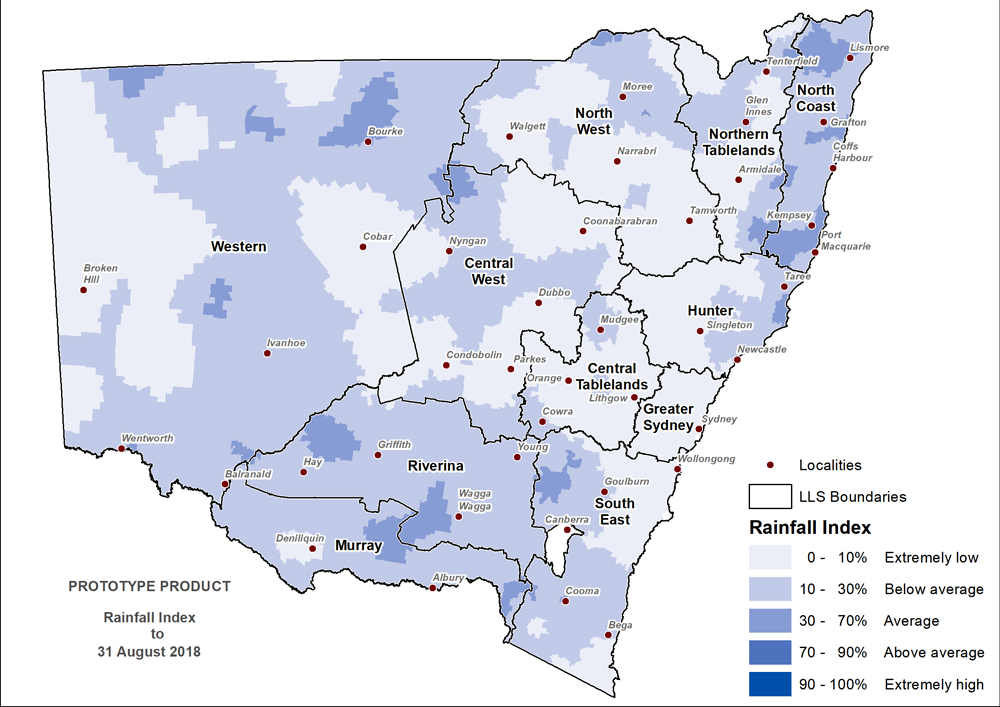
Rainfall Index
The Rainfall Index (RI, Figure 6) shows that the majority of NSW continues to be experiencing below average to extremely low rainfall. There are some parts of the state that are at the lower end of the average range of the Rainfall Index, including parts of Western, Riverina, Murray, South East, and North Coast Local Land Services regions.
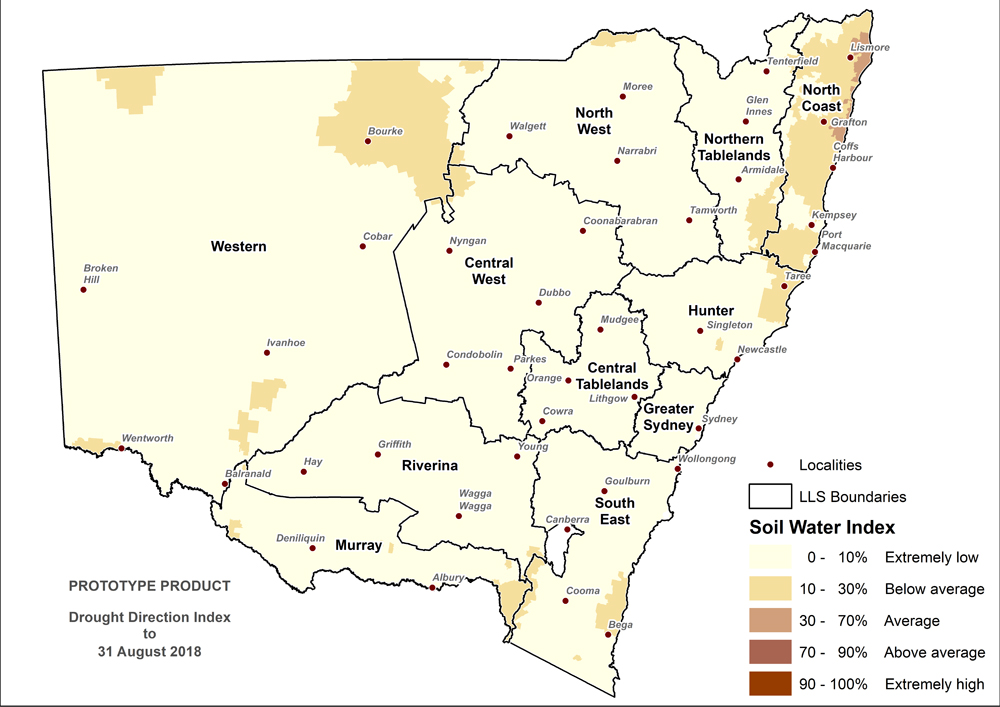
Soil Water Index
The Soil Water Index (SWI, Figure 7) shows that the majority of NSW has stored soil moisture at extremely low levels. The widespread deficit represented by the SWI reflects the on-ground conditions that have been reported to NSW DPI over the past few months.
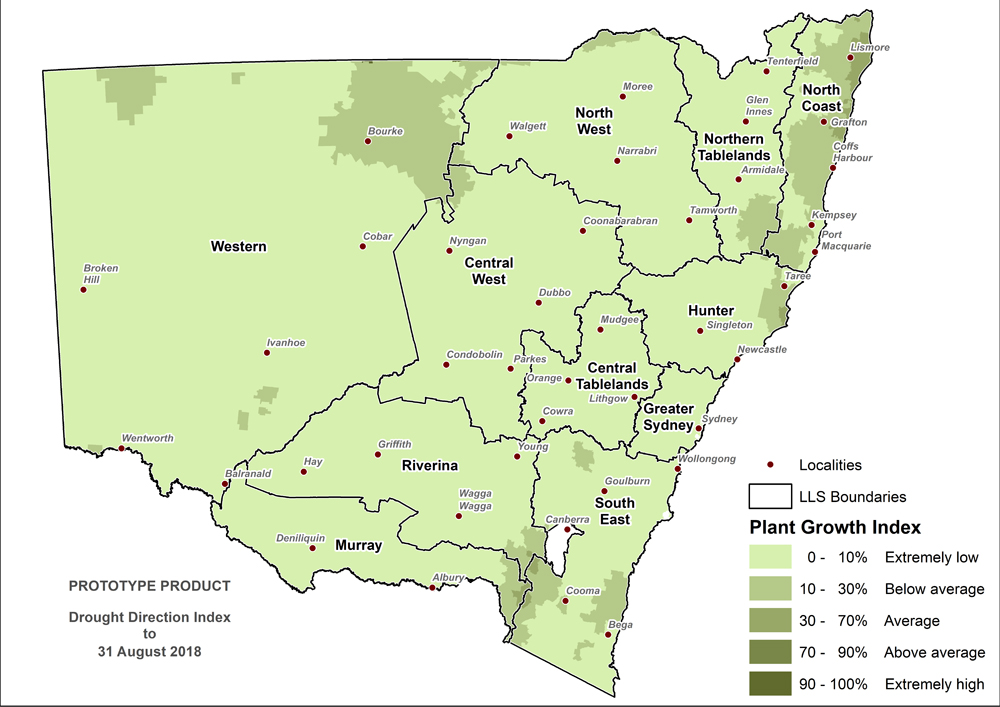
Plant Growth Index
The Plant Growth Index (PGI, Figure 8) is extremely low across most of NSW and largely mirrors the Soil Water Index (SWI). The SWI and PGI are key indicators of the agronomic drought that is currently being experienced across NSW, and provide a closer estimate of visual field conditions that the Rainfall Index at this stage of the drought event.
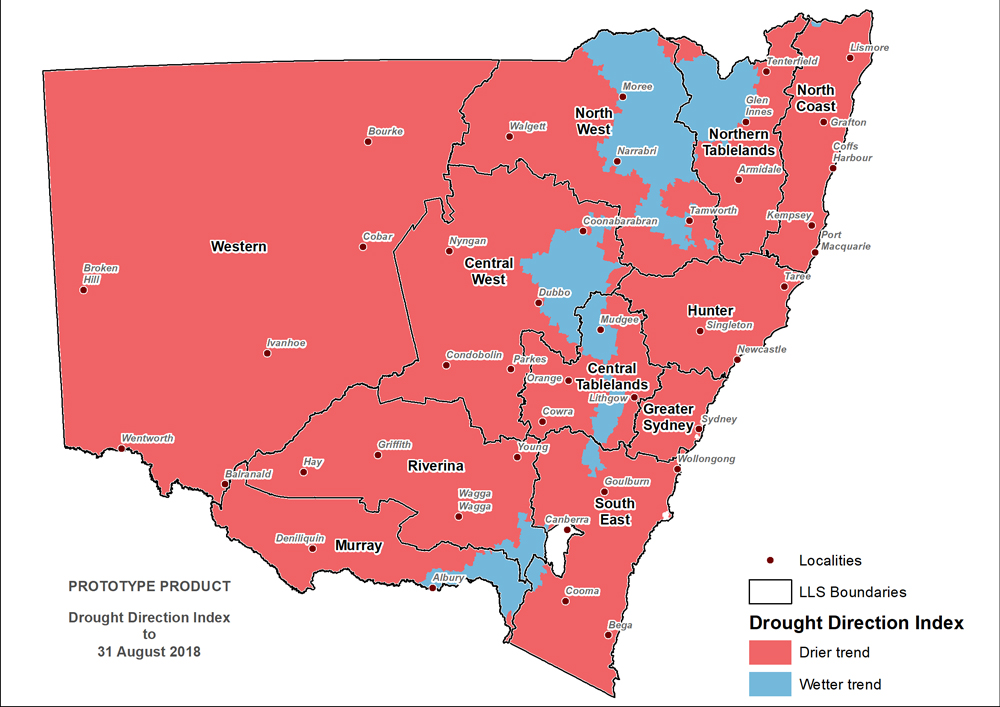
Drought Direction Index
Drought Direction Index (DDI, Figure 9) remains in a drying trend for the majority of NSW. Areas that received significant rainfall during the latter part of August are displaying a wetter trend, however this does not constitute the end to the drought event.
Changes in the individual drought indicators may have occurred since this update was released. For the most current information, please visit DroughtHub.
CDI status for the regions
Figure 10 displays the CDI status for each individual Local Land Services region to 31 August 2018.

Murray and Riverina regions
Significant rainfall (75-150mm) occurred in the alpine zone on the eastern boundary of the Murray and Riverina Local Land Services (LLS) regions in late August. This was accompanied by reasonable falls of rain east of Wagga Wagga, extending north to Young and south to Culcairn-Holbrook. There is an east-west gradient where minimal falls were recorded in the far west of the region, for example around Goolgowi and Hay.
Despite the good falls of rain, the area to the east remains in the Drought Affected category, although the intensity of the event is weakening. This is a conservative assessment and stronger pasture/crop response is expected in the coming weeks which will further alleviate the intensity of the Drought Affected areas.
The remainder of the region remains in the Drought category, largely a result of low soil moisture and poor pasture/crop growth conditions over the last three or four months. Based on available remote sensing, there are isolated areas where crops have germinated, and with recent rainfall, yield potential remains moderate-to-high.
There are isolated areas in the alpine zone where detailed assessment shows that pasture/plant response has been strong. However, this is not reflected in the parish-level drought maps due to the conservative rules that are used to aggregate the data to the regional level.


Western region
Much of the Western Local Land Services (LLS) missed the significant rainfall that fell in more eastern parts of New South Wales. The exception was a region around Bourke that received 10-25 mm as one rainfall event in the third week of August. As a result, drought status remains largely unchanged for the LLS region. Areas currently in the Intense Drought category include the region from Broken Hill north to Tibooburra, south of Menindee, the greater Cobar region and to the north of Euabalong. The Combined Drought Indicator classifies the remaining parts of Western LLS region as either in Drought or Drought Affected.
The monthly NDVI anomaly (Figure 15) data highlights a significant spatial variability experienced on the ground in the Western LLS region. It confirms high levels of plant stress in the Broken Hill and Cobar regions. It also suggests that there are similar conditions in the area south of Menindee to Balranald and Wentworth. There are areas in the Western LLS region where significant improvement in plant condition is evident, particularly the area around Brewarrina, and to a lesser extent, around Ivanhoe. Slight improvement in plant condition is observed along the Darling River.
It is important to note the complex interaction between rainfall, total grazing pressure, and deficiencies in the climate monitoring network in this region. As noted in previous reports, DPI takes a conservative approach to the classification of drought in this region to account for these factors.


North West, Northern Tablelands and North Coast regions
Significant rainfall fell in the North Coast and Northern Tablelands Local Land Services (LLS) regions in August. Some very high falls were recorded around Inverell, where 50-70 mm were recorded. Similar high rainfall events were recorded on the coast around Coffs Harbour and further north at Tweed Heads.
Importantly, the region around Armidale and to a lesser extent, Tamworth, did not receive significant rainfall, having experienced up to 25 mm during the month. The region around Walgett in North West LLS region had very light or no rainfall for the month, and the rainfall deficit has intensified.
The rainfall in August has changed the drought categories where a region between Inverell and Tenterfield has transitioned to the Drought Affected (weakening) category. Similarly, there is a region that appears to be transitioning out of Drought east of Moree. With continued follow-up rain, recovery in these areas will strengthen over the spring of 2018. However, DPI’s conservative assessment is that the region remains Drought Affected at present.
The drought classification has not changed around Walgett, Narrabri, Tamworth and Armidale, and these districts remain in Intense Drought. Much of the region remains in Drought, due to ongoing poor performance of pastures and continuation of the soil moisture deficit.
The monthly NDVI anomaly shows that plant greenness is very low when compared against historical expectations for this time of year. This is mapped right across the region. Importantly, the NDVI anomaly data does not reflect the response of pastures to rainfall between Inverell and Tenterfield, because this region generally has a very high average greenness value for this time of year.


Central Tablelands, Central West, Hunter and Greater Sydney regions
Significant falls of rain fell in the Central Tablelands and parts of the Central West Local Land Services (LLS) regions during August. Falls of up to 60 mm fell around Oberon, Orange and Mudgee, while centres like Coonabarabran, Dubbo, and Wellington had falls of up to 40 mm. The region from Cumnock to Canowindra had less rainfall with totals of up to 30 mm. There are signs of early recovery, with pastures having a growth response given warmer-than-average temperatures, however, field conditions remain highly variable and this response is not uniform across the region.
The western side of the Central West region received minimal rainfall of less than 10 mm. Districts like Parkes, Condobolin, Nyngan and Coonamble, which have been in Drought and Intense Drought, remain areas of significant concern. Similarly, agricultural land in the Sydney Basin did not receive significant rainfall and dryland producers in these areas remain under significant pressure from the rainfall deficit.
August rainfall was highly variable across the Hunter with an area north of Singleton receiving significant falls around 50 mm. However, the districts of Scone, Muswellbrook, and Denman through to Cessnock received less rainfall (10-20 mm), and this area remains in Intense Drought.
The NDVI anomaly data confirms that plant conditions remain poor compared to what is expected at the end of winter, and that there are isolated pockets across these LLS regions where there has been a weak-to-moderate improvement in plant growth.


South East region
Some significant rainfall fell in August around Crookwell (40-60 mm), and also in the alpine areas of the South East Local Land Services (LLS) region. Elsewhere, only light falls of rain (5-10 mm) were recorded.
The region around Crookwell has transitioned to the Drought Affected category, as has much of the alpine area. This is a conservative assessment, and more detailed data suggests that there are isolated areas where significant pasture recovery is underway.
The area between Colo Vale through Mittagong, down to the Kangaroo Valley remains in Intense Drought. Importantly, drought status is assessed relative to long-term historical expectations and these areas are in the high-rainfall zone. Field conditions may appear favourable to observers who do not have this long-term historical reference.
The remainder of the area remains in the Drought or Drought Affected categories, reflecting the drying event which has unfolded across the region over the last six months.
The NDVI anomaly data reflects both the high degree of spatial variability in the pasture base, as well as the relative response of regions to the rainfall deficit.
As described in previous State Seasonal Updates, the monitoring framework and underlying meteorological data do not accurately capture coastal climatic conditions. For this reason, improved conditions along parts of the South East coast are not reflected in the state-wide drought mapping.


Outlook Status
At the time of writing the August State Seasonal Update, the Bureau of Meteorology had released its high level description of the seasonal outlook. However supporting data and detailed model output were not available. This will be updated in the August State Seasonal Update as it become available.
Official national outlook
The official national climate outlook for September to November was issued by the Bureau of Meteorology on 30 August 2018. The outlook shows that drier than normal conditions are expected across Southern Australia, extending up into NSW (west of the Great Diving Range) and central Australia.
September to November daytime temperatures have an increased likelihood of being warmer than normal across Australia. Overnight temperatures also have an increased likelihood of being warmer than average across large parts of Australia. Parts of southern and central Australia have a near equal chance of overnight temperatures being warmer or cooler than average.
NSW outlook
For New South Wales, the rainfall outlook for September to November indicates that there is an increased chance of drier than normal conditions across many areas to the west of the of the Great Dividing Range. Along coastal parts of NSW and central to northern central inland NSW there is a near equal chance of a wetter or drier three months.
The temperature outlook indicates that there is an increased chance of warmer than average daytime temperatures across NSW. The majority of the state has a greater than 60% chance of warmer than average daytime temperatures and increased chance of warmer than average overnight temperatures. Parts of the far south west have a near equal chance of warmer or cooler than normal overnight temperatures.
Climate drivers
ENSO
The El Niño Southern Oscillation (ENSO) remains neutral (as of 28 August 2018), and the Bureau of Meteorology’s ENSO Outlook remains at El Niño Watch, with a 50% chance of El Niño forming in the spring. All of the international climate models surveyed by the Bureau of Meteorology suggest continued warming of the tropical Pacific is likely, with El Niño thresholds likely to be reached by the end of spring.
Southern Oscillation Index and other indicators
The 30-day SOI value (Figure 26) has reached El Niño threshold values during the last week of August, but this pattern is not yet considered robust (30-day value was -7.6, 90-day value was -3.9 as of 26 August 2018).
Cloud levels at the junction of the equator and the International Date Line have fluctuated around average during August, and have generally been below average since February. While below average cloud levels is usually indicative of La Nina, the overall pattern of cloud levels across the Pacific has been more consistent with a neutral ENSO.
Trade winds are currently near average across the entire tropical Pacific (as of 26 August 2018). Generally during an El Niño there is a sustained weakening of trade winds across much of the tropical Pacific.
 to 26 August 2018")
Sea surface temperatures
Monthly sea surface temperatures anomalies (SST) for August (Figure 27) were slightly warmer than average in the tropical Pacific, but still within the neutral range for ENSO. Anomalously warm sea surface temperatures are affecting parts of the South Pacific and North Pacific.
")
Sea Sub-surface Temperatures
Sub-surface temperatures (Figure 28) show a pool of anomalously warm water in the equatorial Pacific. A pool of slightly cooler than average water is also present in the shallow sub-surface of the eastern equatorial Pacific. Overall conditions are consistent with a neutral ENSO.
")
Indian Ocean
The Indian Ocean Dipole (IOD) remains neutral (as of 26 August 2018). Three of the six international climate models surveyed by the Bureau of Meteorology predict that a weak, short-lived positive IOD may develop.
Southern Ocean
The Southern Annular Mode (SAM) is currently near neutral (as at 26 August). The outlook for SAM is to remain neutral to weakly positive into mid-September.
How does it work?
Much of the information in the Seasonal Conditions Report is sourced from the NSW DPI Enhanced Drought Information System (EDIS) ™. The EDIS system is currently available in prototype form and is subject to an intensive ground truthing process. For more information, visit the interactive website via DroughtHub.
EDIS is an ongoing project aimed at improving the quality and timeliness of efforts to monitor conditions across the state. Key features of the system are:
- It tracks drought by using four indicators; rainfall, soil water, plant growth, as well as tracing rainfall trends. Agronomic conditions have equal value to rainfall recorded at meteorological stations.
- The Combined Drought Indicator (CDI) brings this information together, and has been designed to characterise developing drought conditions. The key purpose for building the CDI was as a drought early warning system.
- The rainfall, soil moisture and plant growth indicators in EDIS account for conditions over a 12 month window. This provides a compromise between a highly sensitive indicator (e.g. six months) and a less sensitive indicator (e.g. 24 months).
- Climate and remote sensing data drive the information system at a high resolution, but the CDI is reported at a Parish level.
- Because of its configuration and purpose, there will be differences to the indicator used in the National Drought Monitoring Framework (the Australian Rainfall Deficiency Analyser) which relies on rainfall alone.
- The CDI has three drought categories that characterise NSW according to drought intensity as well as the main drivers of a drought event (meteorological, hydrological and agronomic). DPI considers areas Drought Affected to be experiencing a drought event.
- The Drought Affected category encompasses a wide range of conditions from the very early stages of drought entry through to a drought event becoming intense. This enables the drought monitoring system to detect a drought event early. It is also possible to stay in the Drought Affected category for some period of time.
The way in which the indicators are combined to form the CDI is described in Table 2 below.
Table 2: Description of the Combined Drought Indicator framework
CDI Phase | Technical definition | Description - typical field conditions |
|---|---|---|
Intense Drought | All three indicators (rainfall, soil water, plant growth) are below the 5th percentile | Ground cover is very low, soil moisture stores are exhausted and rainfall has been minimal over the past 6-12 months. |
Drought | At least one indicator is below the 5th percentile | Conditions may be very dry, or agronomic production is tight (low soil moisture or plant growth). It is possible to be in Drought when there has been some modest growth, or a few falls of rain. |
Drought Affected (intensifying) | At least one indicator is below the 30th percentile and the rainfall trend is negative over the past 90 days. | Conditions are deteriorating; production is beginning to get tighter. Ground cover may be modest, but growth is moderate to low for the time of year. When indicators are close to the Drought threshold drought conditions are severe. |
Drought Affected (weakening) | At least one indicator is below the 30th percentile and the rainfall trend is positive over the past 90 days. | Production conditions are getting tighter, but there have been some falls of rain over the past month. It is rare to enter the Recovering phase from the Non-Drought category; Usually there is a quick (1-2 week) transition into Drought Affected or Drought. When indicators are close to the Drought threshold drought conditions are severe. |
Recovering | All indicators are below the 50th percentile but above the 30th percentile | Production is occurring but would be considered ‘below average’. Full production recovery may not have occurred if this area has experienced drought conditions over the past six months. |
Non-drought | At least one indicator is above the 50th percentile. | Production is not limited by climatic conditions. |
The NSW State Seasonal Update is provided each month by the NSW DPI Climate Unit, which is part of the Livestock Systems Branch in DPI Agriculture.
Information used in this report was primarily sourced from the Australian Bureau of Meteorology, the US National Oceanic and Atmospheric Administration, the International Research Institute for Climate and Society (Columbia University) and NSW Department of Primary Industries.
Maps in this document contain data which is © Spatial Services – NSW Department of Finance, Services and Innovation (2018), Panorama Avenue, Bathurst 2795 and data which is © Commonwealth of Australia 2018, Australian Bureau of Meteorology, Melbourne. All rights reserved.
The seasonal outlooks presented in this report are obtained from the Australian Bureau of Meteorology and other sources (including World Meteorological Organisation Global Producing Centres). These outlooks are general statements about the likelihood (chance) of (for example) exceeding the median rainfall or minimum or maximum temperatures. Such probability outlooks should not be used as categorical or definitive forecasts, but should be regarded as tools to assist in risk management and decision making. Changes in seasonal outlooks may have occurred since this report was released. Outlook information was up to date as at 3 September 2018.
All climate and remote sensing input data is supplied to the Enhanced Drought Information System™ under the Australian Creative Commons Licence (CCY 4.0) and is made available by the Terrestrial Ecosystem Research Network
© State of New South Wales through the Department of Industry, Skills and Regional Development, 2018. You may copy, distribute and otherwise freely deal with this publication for any purpose, provided that you attribute the NSW Department of Primary Industries as the owner.
Disclaimer: The information contained in this publication is based on knowledge and understanding at the time of writing (September 2018). However, because of advances in knowledge, users are reminded of the need to ensure that information upon which they rely is up to date and to check currency of the information with the appropriate officer of the Department of Primary Industries or the user’s independent adviser.
Published by the NSW Department of Primary Industries. ISSN 2202-1795 (Online). Volume 6 Issue 6
