

NSW State Seasonal Update - March 2020
Prepared by NSW DPI
NSW overview
The drought event weakened across much of NSW in March 2020, though conditions remain highly variable. Rainfall and temperatures were favourable for pasture and crop growth in parts of northern, central and eastern NSW, however this represents a small percentage of the state. These areas are likely to experience further improvement over the coming weeks, however follow-up rain is needed to maintain this trend through Winter and Spring.
Most of the state remained in drought during March and regions like the far west, as well as parts of the Northern Tablelands and South East remain in Intense Drought. This continues the drought event which now has a 24-36 month duration. The NSW DPI Combined Drought Indicator (CDI) provides a summary of the complex pattern of seasonal conditions unfolding across NSW. The CDI shows 92.2% of NSW remains in one of the three drought categories. The proportion of the state in the Intense Drought and Drought categories fell during March. The Drought Direction Index is tracking improving conditions across much of NSW for a second consecutive month.
Recent rainfall has improved soil moisture levels in most of the state’s cropping regions. Currently there is an improved outlook for the first half of the 2020 winter crop period, though there is still a high reliance on follow-up rainfall to maintain yield potential. Rainfall during April is generally critical for the main crop planting window during May.
Describing the weakening drought conditions as a recovery is highly contentious at this stage. Recovery is a difficult phase of drought to monitor accurately, as the extent and strength of the change in on-ground conditions is dependent on the amount, timing and effectiveness of the rainfall. Farm level recovery from droughts are highly variable within a region, and this is confirmed by new satellite imagery of current ground conditions used in this edition of the SSU. The risk of ‘false recovery’ is still possible and this is a key period of exposure of farm businesses managing a long-term drought event. As a result, a ‘watch and monitor’ status is advised for Government, regions and farm businesses during this transition period.
The official Seasonal Climate Outlook released by the Bureau of Meteorology (BoM) 2 April 2020 was also more positive than previous months. It indicates that the majority of NSW has a moderate to high chance of receiving wetter than median rainfall in the April to June period. This is a significant change compared to the last several months, however there is still a degree of caution for the current outlook. The forecasting skill is low to moderate at this time of year and the main global climate drivers have retained a neutral status over the last fortnight. The current seasonal forecast is driven by local synoptic systems which can be highly variable.
Drought Support
Producers and members of rural communities are encouraged to maintain contact with their local professionals who can facilitate access to appropriate support. If you or someone you know needs support, please visit DroughtHub. Alternatively, you can contact the DPI Rural Resilience Team, Rural Financial Counsellors, or your Local Land Services representatives.

It is important to recognise the CDI provides an aggregated view of the State, and that on-ground conditions can be different to those displayed in the maps. They provide an ‘on average’ view of a particular region only. To report local conditions, use DPI Farm Tracker.
Drought Duration
Drought duration is an important component of drought impact on farm businesses and communities. The drought duration map (Figure 2) shows the number of months since June 2017 that an area in NSW has been in one of the three CDI drought categories. The map shows that NSW continues to experience long-term drought conditions at 31 March 2020; The majority of NSW has experienced drought conditions for longer than 24 months.
*Note: The accumulated months reported are non-consecutive.

Rainfall
Most of NSW received more than 50mm of rain in March (Figure 3a). Parts of the Central West, Central Tablelands, Hunter, North Coast and Sydney region received higher totals of more than 100mm. These totals were also received in parts of the South East, Murray, North West and Western Local Land Service (LLS) regions but were isolated occurrences. Lower rainfall totals of less than 50mm were also common in Western NSW but also occurred in the South East and Northern Tablelands.
Rainfall accumulation for 2020 has been near or above average for much of NSW. The far west remains drier than average. Rainfall totals in central NSW and further east (Figure 3b) positioned these regions up for recovery over the next few months if follow-up rain is received. There is currently a widespread rain event occurring in the first week of April. This could provide further improvement to conditions across some parts of the state.


Temperature
The average March daytime temperatures (Figure 4) were above 24°C across most of NSW, with temperatures increasingly higher towards the west and the north of the state. The South Coast and tablelands areas experienced temperatures between 18-24°C.
Overnight temperatures (Figure 5) were above 12°C across most of NSW. Overnight temperatures were higher in most of the western and northern NSW. The Tablelands and alpine areas experienced lower temperatures ranging between 3-12°C.
Bureau of Meteorology data indicates that daytime temperatures were generally cooler than average for most of NSW in March and overnight temperatures were average to above average across NSW.


Normalised Difference Vegetation Index (NDVI) Anomaly
NSW DPI and Geoscience Australia (Digital Earth Australia program) have developed a new remote sensing analysis for NSW, with an interim (beta) product included in this edition of the State Seasonal Update (Figure 6a). This is being phased in to replace the remote sensing analysis (Figure 6b) used in previous editions, which has data quality problems.
The new analysis includes fortnightly passes of the satellite to build a seasonal estimate, in this case for the three months from January to March, up to 8 March. It highlights the significant variability in field conditions being experienced across NSW. For comparison, the monthly standardised anomaly (Figure 6b) indicates whether current NDVI values are below or above what is expected at this time of year.
The new analysis highlights there are parts of the North Tablelands, North West, Hunter, Riverina and eastern LLS regions where plant condition (greenness) is above expectations for summer/early autumn. There are also some isolated areas across NSW where a similar plant response is seen in the data.
The analysis reinforces that while the drought has been weakening, a complex situation is unfolding across NSW with significant variability between and within regions. While improved plant conditions are evident in some areas, much of NSW has vegetation that is below expectations for this time of year. A number of technical factors need to be considered when considering the new analysis:
- It is based on the USGS Landsat satellite, quality-controlled and provided by Geoscience Australia's Digital Earth Australia program. This collects data at a 30m spatial resolution every two weeks, contrasting to the 1km resolution of the previous product.
- There is a processing lag in Landsat data of up to ~3-4 weeks, therefore the most recent period is not available.
- The visible and infrared bands are used to calculate NDVI, which then calculates vegetation greenness. This is a useful measure of vegetation density and plant health.
- Clouds and smoke can sometimes obstruct observations, causing gaps in the NDVI data or banding in the available imagery. As seen in the Figure 6a, smoke and clouds obscured much of the southeast over the last 3 months, resulting in missing data.
- Figure 6b indicates generally lower NDVI values than the new data displayed in Figure 6a. This is due to the technical issues with the NOAA satellite which causes low bias values (see Note below).
- Note, The Bureau of Meteorology (BoM) issued a Service Caution Notice late in 2019 as follows: From March 2019, and possibly earlier, NDVI data have shown lower values in southern Australia due to a drift in the source NOAA satellite. The issue is being investigated and we expect corrections to be made in the coming two months. In the interim, please note the data may have a low (brown) bias and should be used with caution. This notice applies to the data shown in Figure 6b.


NSW Farm Dam Survey
Figure 7a and 7b compares farm dam levels at the end of 2019 (11 November 2019 to 12 December 2019) to the latest available observations (24 January 2020 to 8 March 2020). There has been a general improvement to farm dam levels in much of north eastern NSW as well as isolated areas throughout coastal, central and western NSW. However, there is a large area of NSW where dam levels remain very low. This information helps verify the distribution and intensity of the rainfall that has been occurring across the state during 2020. It also shows some consistency with the pasture growth response and normalised difference vegetation index (Figure 6a). Follow-up rainfall is still required to improve many of the state’s farm dam levels. The NSW DPI and Geoscience Australia monitor 67,000 farm dams each month by the Landsat satellite and report average information for each parish.


Short-term Soil Moisture and Plant Growth
Maps of the short-term soil moisture (Figure 8a) and pasture response (Figure 8b) to the February and March rainfall shows that the east of the state experienced improved conditions over the last 30 days. Despite this, there is significant variation within regions, particularly in the transition zones from east to west. On the ground this appears as areas of greening pasture with some growth of biomass over the last month. Without the continuation of follow-up rain these responses will be temporary. Detailed assessments available through NSW DPI FarmTracker highlight that while the response has been positive, pastures still need time and rain to produce increased dry matter and to support a change from drought grazing tactics for much of NSW.


Soil Water Index
The Soil Water Index (Figure 9, SWI) remains below average to extremely low across the majority of NSW. Despite average rainfall totals across much of NSW during 2020 this is not reflected in the SWI. While the index suggests slightly better soil moisture conditions in parts of the Western Local Land Services region, the Plant Growth Indicator, on-ground reports and available satellite imagery continue to indicate that field conditions are highly variable.
 to 31 March 2020")
Plant Growth Index
Despite recent rain, the Plant Growth Indicator (Figure 10, PGI) continues to show large areas of below average to extremely low plant growth. Despite parts of western NSW having a slightly improved PGI Index compared to other areas of the state, field reports and the available satellite imagery indicate low levels of plant health (greenness) relative to expectations for late summer and early autumn.
 to 31 March 2020")
Rainfall Index
Despite near average rainfall occurring across much of NSW during 2020, the Rainfall Index (Figure 11, RI) is still below average for most of the state. This suggests that rainfall deficits have been severe over the last twelve months. Despite large variability, the RI has returned to near average levels in isolated parts of the Western, North West, North Coast, Greater Sydney, Murray and the Riverina Local Land Service (LLS) regions. Rainfall totals in these areas have been enough, relative to average, to begin rebuilding the long-term rainfall deficits.
 to 31 March 2020")
Drought Direction Index
The Drought Direction Index (Figure 12, DDI) indicates that the recent few months of rainfall across NSW is beginning to change the long-term drying trend that has been evident across much of the state. Central and eastern areas are displaying a wetting trend for a second consecutive month. The wetter trend has extended into parts of western NSW during March. There are still large areas across this region that show a drying trend and rainfall is needed to initiate any change to existing drought conditions.
 to 31 March 2020")
Changes in the individual drought indicators may have occurred since this update was released. For the most current information, please visit DroughtHub.
CDI status for the regions
Figure 13 displays the CDI status for each individual Local Land Services region to 31 March 2020. The regional descriptions are based on data available until the end of March 2020. It does not include the rainfall event occurring across NSW at the time of compiling this month’s State Seasonal Update.

Murray and Riverina regions
Despite isolated rain in March, the Murray and Riverina Local Land Services (LLS) regions continue to experience widespread drought conditions. The Combined Drought Indicator (CDI) shows most of the region is in one the three CDI drought categories (Figure 14). The rain during 2020 has caused some of the region to transition out of the more intense CDI drought categories since January. Further rainfall prior to the winter feed gap is required to sustain the improvement to field responses and enhance conditions for winter crop planting activities.
The seasonal NDVI anomaly data (Figure 15) shows that the LLS regions continue to experience below normal levels of greenness, particularly to the south and east of Tumut. The effects from the severe bushfire season is impacting the anomaly in some of these areas. Elsewhere dryness has constrained plant growth for several months. The seasonal NDVI anomaly indicates that there have been improvements across some of the region. This is likely in response to the recent rain, though more time is needed for the response to be understood.
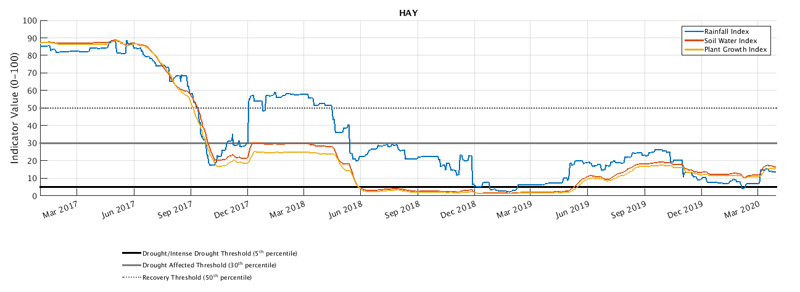
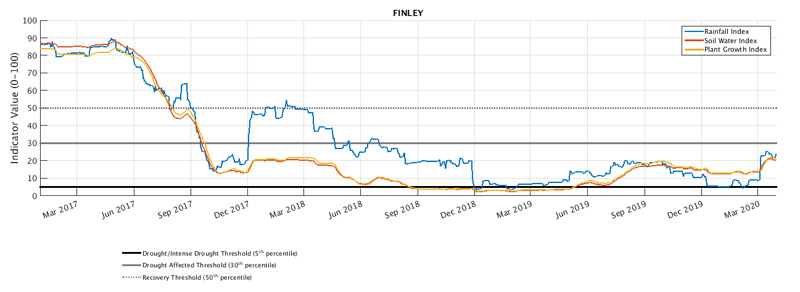
The time series charts (Figure 16) shows the individual response of the drought indices for Hay, Finley and Temora. Despite recent improvements to the indices, follow-up rain is still needed to continue the improvements and initiate a recovery from drought conditions. As shown in Figure 15, most of the indices had plateaued towards the end of March due to the absence of follow-up rain during the month.


Western region
Most of the Western Local Land Services (LLS) region continued to experience widespread drought conditions during March. The Combined Drought Indicator (CDI) showed a transition from the Drought Affected to Recovery and Non-drought categories (Figure 17) for some parts of the region. This was due to high rain totals received in these areas. Despite the rain, the available satellite imagery and field reports continue to indicate relatively poor on-ground conditions and that the potential response to any rainfall received is still unfolding. The Soil Moisture and Plant Growth Indices are also showing a typical delayed response to the rain and remain relatively low.
Generally, rainfall was highly variable and many areas received low rain total totals during the month. There was little if any improvement to conditions in these areas. While the drought may have weakened in some areas, the drought is not over. Consistent follow-up rain remains critical for a sustained improvement across the region and there are large areas that still require an effective rainfall event to initiate a weakening of drought conditions.
The seasonal NDVI anomaly data (Figure 18) shows below normal levels of greenness compared to the long-term expectations for the January to early March period across most of the region. This has been driven by long-term dryness, ineffective rainfall and a low groundcover. In addition to enduring dryness, producers in the west and far west are also managing the effect of total grazing pressure and hot conditions prior to autumn. There are isolated signs of improvement in parts of the region, especially near Wanaaring and in an area between Cobar and Wilcannia. The recent rainfall may continue to improve plant growth, however more time is needed to gauge the response to this rain.
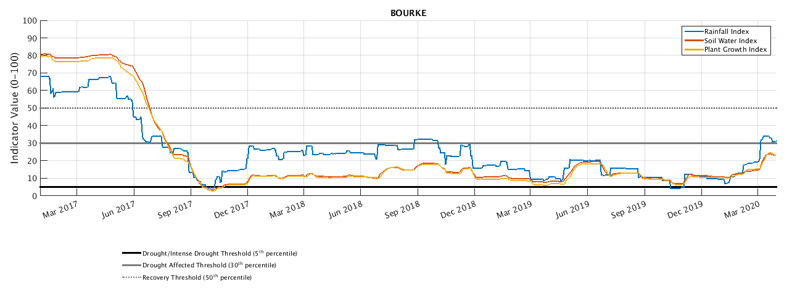
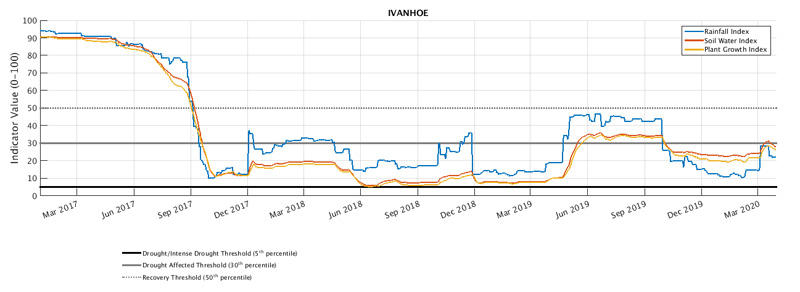
The time series charts (Figure 19) show the individual response of the drought indices for Bourke, Ivanhoe, and Wentworth. All locations show an extended period of poor conditions. There is an example of a false early-stage recovery at Ivanhoe in April and May 2019, highlighting the importance of follow-up rainfall for sustaining longer-term drought recovery. There was a recent improvement to the Rainfall Index at Bourke and Ivanhoe in March, however the soil moisture and plant growth indices showed a modest response and plateaued rapidly. The continuation of follow-up rain is needed to sustain improvement in conditions. Wentworth has remained comparatively dry in 2020 and there has been no relief to drought conditions.


North West, Northern Tablelands and North Coast regions
Despite rain during 2020, the majority of the North West, Northern Tablelands and North Coast Local Land Services (LLS) regions continue to be in one of the three Combined Drought Indicator (CDI) drought categories (Figure 20). The CDI shows that the soil moisture and plant growth indicators have responded to the rain, though further rain is needed. Parts of the North Coast experienced very high rain totals in February and transitioned into the Non-drought category. A dry month with lack of follow up rain in the far north east has caused some these Non-Drought areas to revert back to a drought category during March. This shows the importance of follow-up rain to sustain the potential of longer-term recovery.
The seasonal NDVI anomaly data (Figure 21) shows that most of the North West and North Coast LLS regions continue to experience below normal levels of greenness for the January to early March period. Despite the rain during 2020, this indicates that the plant growth response is slow and likely requires more rain. The impact of the severe bushfire season is still contributing to the NDVI anomalies at present, particularly in areas further east. The seasonal NDVI anomaly in the central area of the Northern Tablelands LLS and south east of the North West LLS region are showing isolated signs of improvement. Rainfall has been more effective on plant growth in these regions and follow-up rainfall would continue the positive response.
The time series charts (Figure 22) showing the individual response of the drought indices for Moree, Walgett and Tenterfield reflect the long-term trend of the drought indices tracking in the bottom 5th percentile of the historic range. Despite the recent rain, the improvement to the indices are modest and plateaued quickly at the end of March. The time series chart for Lismore was included in this month's update to illustrate the indices in a region that has recently transitioned out of drought into the Recovery CDI category and quickly reverted to the Drought Affected category. Very high rainfall in February led to a rapid increase in the Rainfall Index, where it was above the 50th Percentile (Median) for a short period. The Soil Water and Pasture Growth Indices also increased but lagged the Rainfall Index. All indices fell at the end of March. Comparing the time series, the drought event at Lismore has been shorter and less intense than the other locations at Walgett, Moree and Tenterfield. This initially led to a faster recovery from drought but also highlights the importance of follow-up rainfall despite the high amount of rain received over recent months around Lismore.


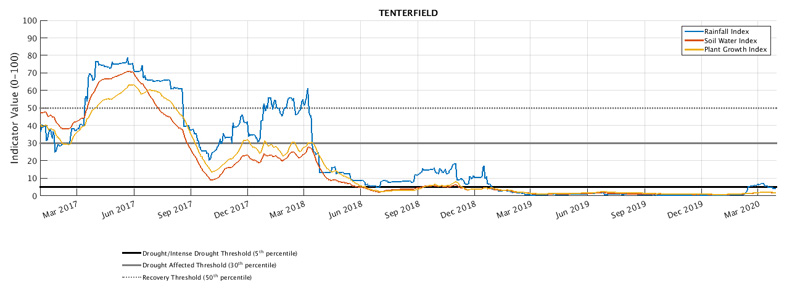
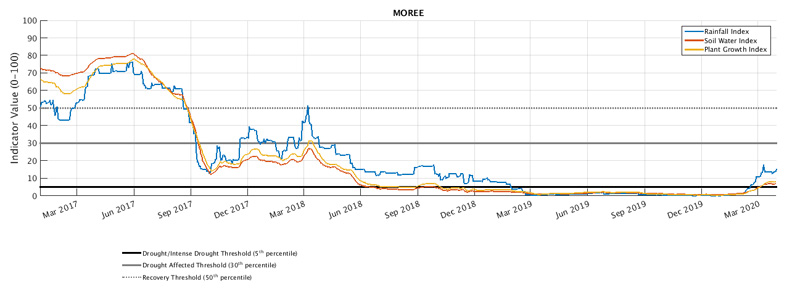
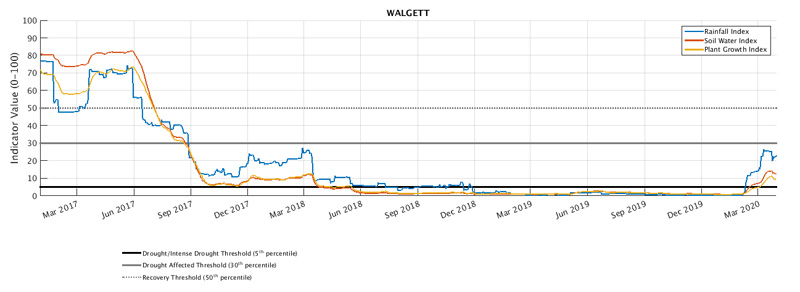
, North West (Moree & Walgett) and North Coast (Lismore).")
Central Tablelands, Central West, Hunter and Greater Sydney regions
The Central Tablelands, Central West, Hunter and Greater Sydney Local Land Services (LLS) regions experienced a reduction in the area categorised in the Intense Drought category during March. Rainfall accumulation during 2020 has weakened drought conditions in much of the area. Despite this, the Central West, Hunter and Central Tablelands LLS regions remain in one of the three Combined Drought Indicator (CDI; Figure 23) drought categories. This reflects the extent of on-going drought conditions being experienced and that the soil moisture and plant growth indicators have been slow to respond to rain. The Greater Sydney LLS continued the recent improvement to conditions. The 2020 rainfall accumulation has been more effective in this region and most of the region remained in the Non-drought category for a second consecutive month.
The seasonal NDVI anomaly data (Figure 24) shows the continuation of below normal levels of greenness compared to expectations for the January to early March period across most of the region. The impact of the severe bushfire season is also contributing to the seasonal NDVI anomalies at present. Despite this, there has been improvements in the levels of greenness in some areas, particularly in the north east of the Hunter LLS region and around Gilgandra and Dubbo. The response from the rainfall received in late March could still be occurring and further follow-up rain will assist improvements in plant growth as the winter feed gap approaches for much of the region.
The time series charts (Figure 25) show the individual response of the drought indices for Cowra, Condobolin and Singleton. Drought conditions have impacted the region for an extended period, where the soil moisture and plant growth indices have struggled to surpass the lowest 10th percentile of the long-term data. Despite recent rain, the improvement to the indicators have been modest and further rain is required to sustain longer-term improvement. Singleton shows the greatest improvement in the indices during February, however the improvements plateaued quickly during March highlighting the importance of follow-up rain.


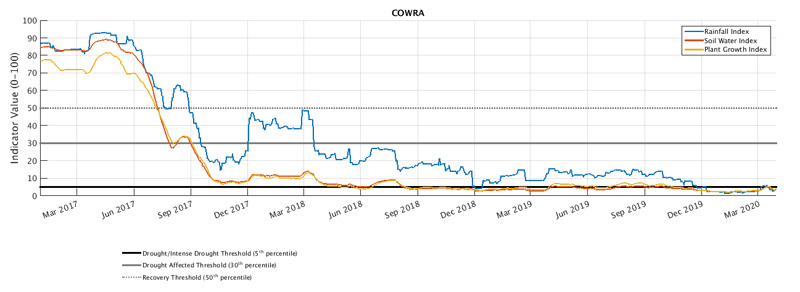
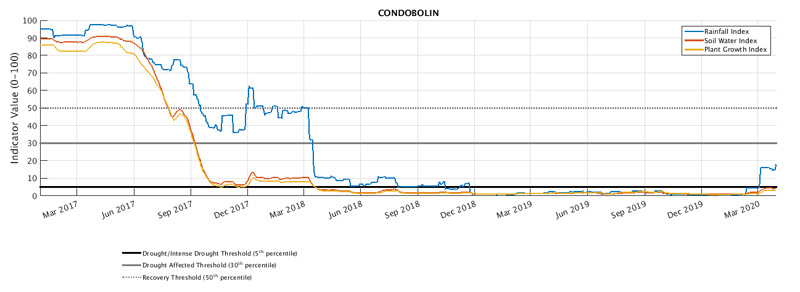
, Central West (Condobolin), and Hunter (Singleton).")
South East region
The South East Local Land Services (LLS) region experienced an increase in the Intense Drought category during March. Despite the rainfall during 2020, there was not enough follow-up rain in March to maintain the recent improvements to conditions. The entire region is in one of the three CDI drought categories (Figure 26). This highlights the extent of on-going drought conditions that have been experienced. More rain is needed to provide a sustained improvement to conditions.
The seasonal NDVI anomaly data (Figure 27) indicates widespread below normal levels of greenness compared to expectations for the January to early March period. This has been driven by insufficient rain and poor agronomic activity over several months. The impact from the severe bushfires is also evident in the seasonal NDVI anomaly data. Rainfall during 2020 has caused some sporadic improvements to plant greenness near Boorowa, south of Jindabyne and north east of Mittagong.
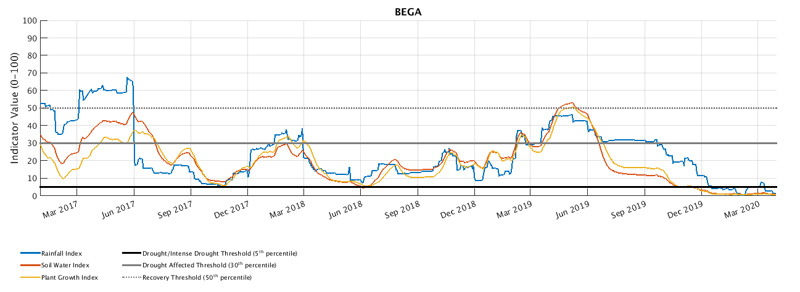
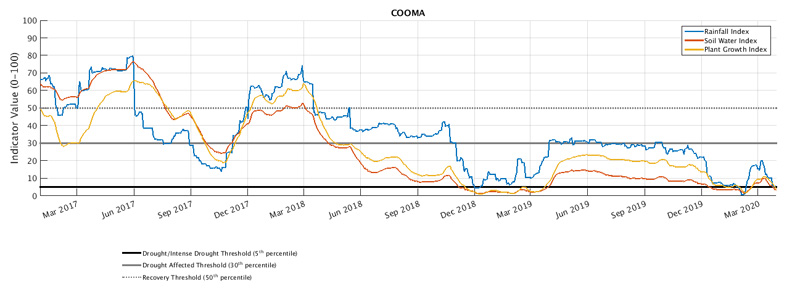
The time series charts (Figure 28) show the individual response of the drought indices at Bega, Goulburn and Cooma. Except for Bega, there was an improvement to the indicators in February. Lack of follow-up rain during March led to the indicators falling quite quickly. This highlights the importance of follow-up rain to sustain a long-term improvement to conditions. Bega shows an example of a false recovery between March and June 2019. This was the result of follow-up rain not being received to maintain a longer-term recovery to drought.


Official national outlook
The official National Climate Outlook was released by the Bureau of Meteorology (BoM) on 2 April 2020. April to June is indicating a high probability of exceeding above median rainfall for most of Australia, except for parts of Tasmania and along the eastern seaboard which have near equal chance of being wetter or drier than median. The northern part of Cape York and north-eastern Northern Territory have a high probability of receiving below median rainfall.
Daytime temperatures for April to June have an increased likelihood of being above median temperatures across northern Australia, along the NSW and eastern Victorian coastlines and extending into eastern Tasmania. Elsewhere the probability of cooler than median daytime temperatures is likely. Overnight temperatures have a high probability of being warmer than median for most of Australia.
NSW outlook
There are high probabilities of rainfall being above median across regional NSW for April to June 2020, except for coastal regions (Figure 29). The rainfall outlooks historical skill for the forecast period is between 50 to 65 percent for most of NSW which is considered low to moderate.
Given that the global climate drivers retained a neutral status over the last fortnight, the current rainfall outlook is largely being driven local synoptic patterns. These are captured by the Bureau’s dynamic forecast model, whereas outlooks that rely on the global climate drivers alone are not as optimistic.

The BoM temperature outlook for April to June (Figure 30) indicates daytime temperatures have an increased likelihood of being below median for most of NSW. In contrast overnight temperatures have an increased likelihood of being above median across NSW (Figure 31).


Climate drivers
El Niño–Southern Oscillation (ENSO)
The Bureau of Meteorology’s (BoM) El Niño–Southern Oscillation (ENSO) Outlook was released on 31 March 2020. All ENSO indicators in the tropical Pacific Ocean remain neutral.
Six of the eight international climate models indicate that ENSO is likely to remain in the neutral range through the southern hemisphere winter, although there appears to be a cooling trend towards a La Niña state in the long term data (4-6 month out). However, ENSO predictions during autumn tend to have lower accuracy than at other times of year, meaning that current forecasts beyond May should be used with caution.
Southern Oscillation Index
The average Southern Oscillation Index (SOI) for the 30 days ending 29 March 2020 was -5.8. The 90-day value was -2.0. Sustained negative values of the SOI below −7 typically indicate El Niño while sustained positive values above +7 typically indicate La Niña. Values between +7 and −7 generally indicate neutral conditions.
 to 2 February 2020")
Sea surface temperatures
Sea surface temperatures (SSTs) for the week ending 29 March were slightly warmer than average across most of the equatorial Pacific Ocean but remain within the neutral range. Water has cooled slightly in the western equatorial Pacific compared to two weeks ago.
SSTs also remain warmer than average around most of Australia. Temperatures are up to two degrees warmer than average around most of Western Australia, and up to one degree warmer than average across large parts of the Coral Sea and the Tasman Sea.
The latest values of the three key NINO indices in the tropical Pacific for the week ending 29 March were: NINO3 +0.4 °C, NINO3.4 +0.5 °C and NINO4 +0.6 °C.
Persistent NINO3 or NINO3.4 values warmer than +0.8 °C are typical of El Niño, while persistent values cooler than −0.8 °C typically indicate La Niña.
")
Sea sub-surface temperatures
The four-month sequence of equatorial sub-surface temperature anomalies (to March 2020) shows the top 150 m of the eastern equatorial Pacific are neutral. There is cooler than average waters at greater depth. This cooler anomaly extends across the remainder of the equatorial Pacific. The pattern has remained somewhat similar since November, with mostly weak to moderate temperature anomalies at the surface.
")
Indian Ocean
The Indian Ocean Dipole (IOD) is neutral. The IOD typically has little influence on Australian climate from December to April. When the monsoon trough shifts southwards into the southern hemisphere at this time of year, it changes the broadscale wind patterns. This means that the IOD pattern is unable to form. The latest weekly value to 29 March was +0.1°C.
Presently most of the international climate models indicate a neutral IOD for the coming months. However, the accuracy of IOD forecasts at this time of year is low.
Southern Ocean
The Southern Annular Mode (SAM) is currently neutral. The SAM has little influence on Australian climate during autumn.
How does it work?
Much of the information in the Seasonal Conditions Report is sourced from the NSW DPI Enhanced Drought Information System (EDIS) ™. The EDIS system is currently available in prototype form and is subject to an intensive ground truthing process. For more information, visit the interactive website via DroughtHub.
EDIS is an ongoing project aimed at improving the quality and timeliness of efforts to monitor conditions across the state. Key features of the system are:
- It tracks drought by using four indicators; rainfall, soil water, plant growth, as well as tracing rainfall trends. Agronomic conditions have equal value to rainfall recorded at meteorological stations.
- The Combined Drought Indicator (CDI) brings this information together, and has been designed to characterise developing drought conditions. The key purpose for building the CDI was as a drought early warning system.
- The rainfall, soil moisture and plant growth indicators in EDIS account for conditions over a 12 month window. This provides a compromise between a highly sensitive indicator (e.g. six months) and a less sensitive indicator (e.g. 24 months).
- Climate and remote sensing data drive the information system at a high resolution, but the CDI is reported at a Parish level.
- Because of its configuration and purpose, there will be differences to the indicator used in the National Drought Monitoring Framework (the Australian Rainfall Deficiency Analyser) which relies on rainfall alone.
- The CDI has three drought categories that characterise NSW according to drought intensity as well as the main drivers of a drought event (meteorological, hydrological and agronomic). DPI considers areas Drought Affected to be experiencing a drought event.
- The Drought Affected category encompasses a wide range of conditions from the very early stages of drought entry through to a drought event becoming intense. This enables the drought monitoring system to detect a drought event early. It is also possible to stay in the Drought Affected category for some period of time.
The way in which the indicators are combined to form the CDI is described in Table 1 below.
Table 1: The way in which the indicators are combined to form the CDI.
CDI Phase | Technical definition | Description - typical field conditions |
|---|---|---|
Intense Drought | All three indicators (rainfall, soil water, plant growth) are below the 5th percentile | Ground cover is very low, soil moisture stores are exhausted and rainfall has been minimal over the past 6-12 months. |
Drought | At least one indicator is below the 5th percentile | Conditions may be very dry, or agronomic production is tight (low soil moisture or plant growth). It is possible to be in Drought when there has been some modest growth, or a few falls of rain. |
Drought Affected (intensifying) | At least one indicator is below the 30th percentile and the rainfall trend is negative over the past 90 days. | Conditions are deteriorating; production is beginning to get tighter. Ground cover may be modest, but growth is moderate to low for the time of year. When indicators are close to the Drought threshold drought conditions are severe. |
Drought Affected (weakening) | At least one indicator is below the 30th percentile and the rainfall trend is positive over the past 90 days. | Production conditions are getting tighter, but there have been some falls of rain over the past month. It is rare to enter the Recovering phase from the Non-Drought category; Usually there is a quick (1-2 week) transition into Drought Affected or Drought. When indicators are close to the Drought threshold drought conditions are severe. |
Recovering | All indicators are below the 50th percentile but above the 30th percentile | Production is occurring but would be considered ‘below average’. Full production recovery may not have occurred if this area has experienced drought conditions over the past six months. |
Non-drought | At least one indicator is above the 50th percentile. | Production is not limited by climatic conditions. |
The NSW State Seasonal Update is provided each month by the NSW DPI Climate Branch.
Information used in this report was primarily sourced from the Australian Bureau of Meteorology, the US National Oceanic and Atmospheric Administration, the International Research Institute for Climate and Society (Columbia University), Geoscience Australia’s Digital Earth Australia Program, and NSW Department of Primary Industries.
Maps in this document contain data which is © Spatial Services – NSW Department of Finance, Services and Innovation (2020), Panorama Avenue, Bathurst 2795 and data which is © Commonwealth of Australia 2020, Australian Bureau of Meteorology, Melbourne. All rights reserved.
The seasonal outlooks presented in this report are obtained from the Australian Bureau of Meteorology and other sources (including World Meteorological Organisation Global Producing Centres). These outlooks are general statements about the likelihood (chance) of (for example) exceeding the median rainfall or minimum or maximum temperatures. Such probability outlooks should not be used as categorical or definitive forecasts, but should be regarded as tools to assist in risk management and decision making. Changes in seasonal outlooks may have occurred since this report was released.
All climate and remote sensing input data is supplied to the Enhanced Drought Information System ™ under the Australian Creative Commons Licence (CCY 4.0) and is made available by the Terrestrial Ecosystem Research Network.
© State of New South Wales through the Department of Industry, Skills and Regional Development, 2020. You may copy, distribute and otherwise freely deal with this publication for any purpose, provided that you attribute the NSW Department of Primary Industries as the owner.
Disclaimer: The information contained in this publication is based on knowledge and understanding at the time of writing (January 2020). However, because of advances in knowledge, users are reminded of the need to ensure that information upon which they rely is up to date and to check currency of the information with the appropriate officer of the Department of Primary Industries or the user’s independent adviser.
Published by the NSW Department of Primary Industries. ISSN 2202-1795 (Online). Volume 8 Issue 3.
