Drought Indicators
The NSW DPI Combined Drought Indicator (CDI) includes four indicators for rainfall, soil moisture, plant growth and drought direction which, used together, can indicate the five phases of drought.
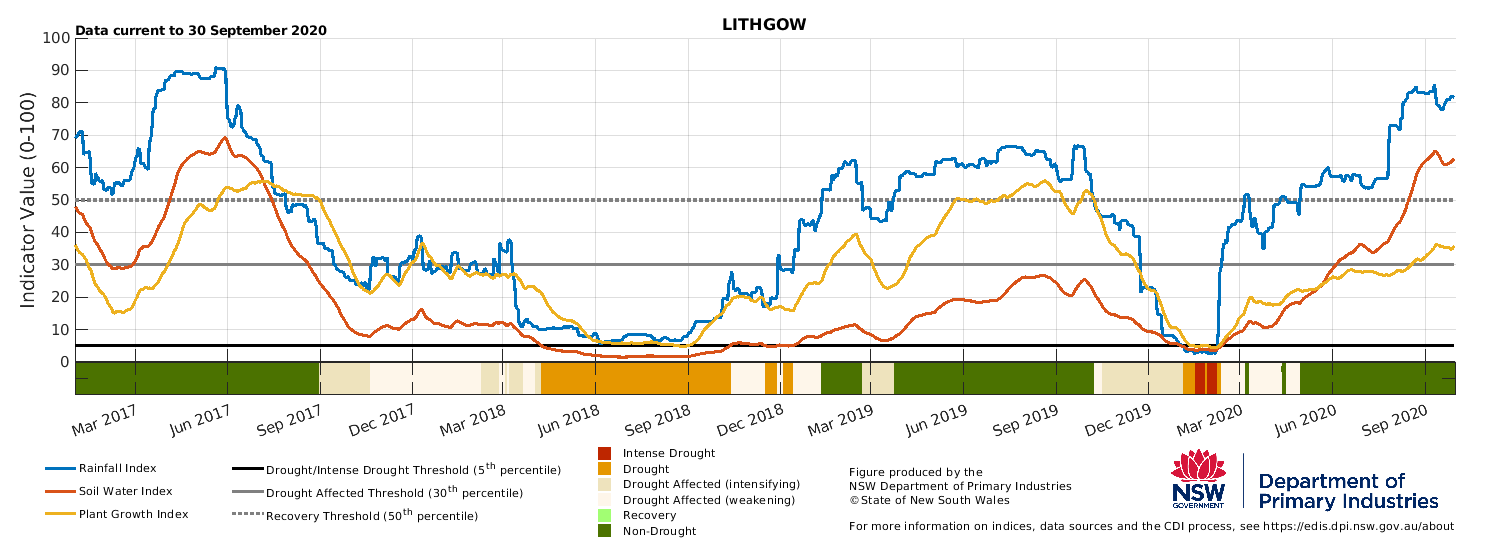
Rainfall Index (RI)
The RI is the percentile rank of rainfall aggregated over 12 months. The ranking is made using a 30 year (1980-2010) baseline which captures recent big shifts in climate variability, and factors in climate change. This provides an index between 0 and 100 where values approaching 0 are close to driest, and those approaching 100 close to the wettest, for any given region. Percentile-based indices like the RI have a uniform distribution regardless of their climatic setting, which is an attractive feature in NSW given the presence of rangeland, temperate and sub-tropical climates which have skewed, normal and log-normal rainfall distributions.
Soil Water Index (SWI)
The SI is calculated using the same procedure as the RI, but uses a soil moisture field derived from the DPI AgriMod soil water balance. Plant available soil water from layer one (0-10cm) and layer two (11-45 cm), the assumed maximum rooting zone, are aggregated and used to calculate the SWI. Similar to the RI, the SWI is an index between 0 and 100. In most districts of NSW a value of 0 means there is no plant available water held in the profile. The SWI is a hydrological index, but its configuration means that it is more useful as an indicator of conditions for dryland than irrigated agriculture.
Plant Growth Index (PGI)
The PGI is calculated using the same general procedure as the RI, using the output from DPI’s crop and pasture models. Crop stress and pasture growth data are taken from DPI AgriMod, and the percentile rank calculated for each day. If the predominant land use in a given area is cropping, the PGI uses the crop-derived data, otherwise it uses the pasture growth indicator. The PGI is an agronomic drought index which is not only sensitive to moisture but also temperature variation and seasonal events such as frost. It is important to note that the PGI tracks the influence of climate on production potential across broad areas only. This provides a regional indicator of conditions. In the paddock, management decisions like fertiliser application and timing, sowing times and stocking rates drive outcomes on the ground, and in-field conditions can be above or below the regional indicator reported by EDIS.
Visit NSW DPI's Drought Monitoring page to find out more about the program.