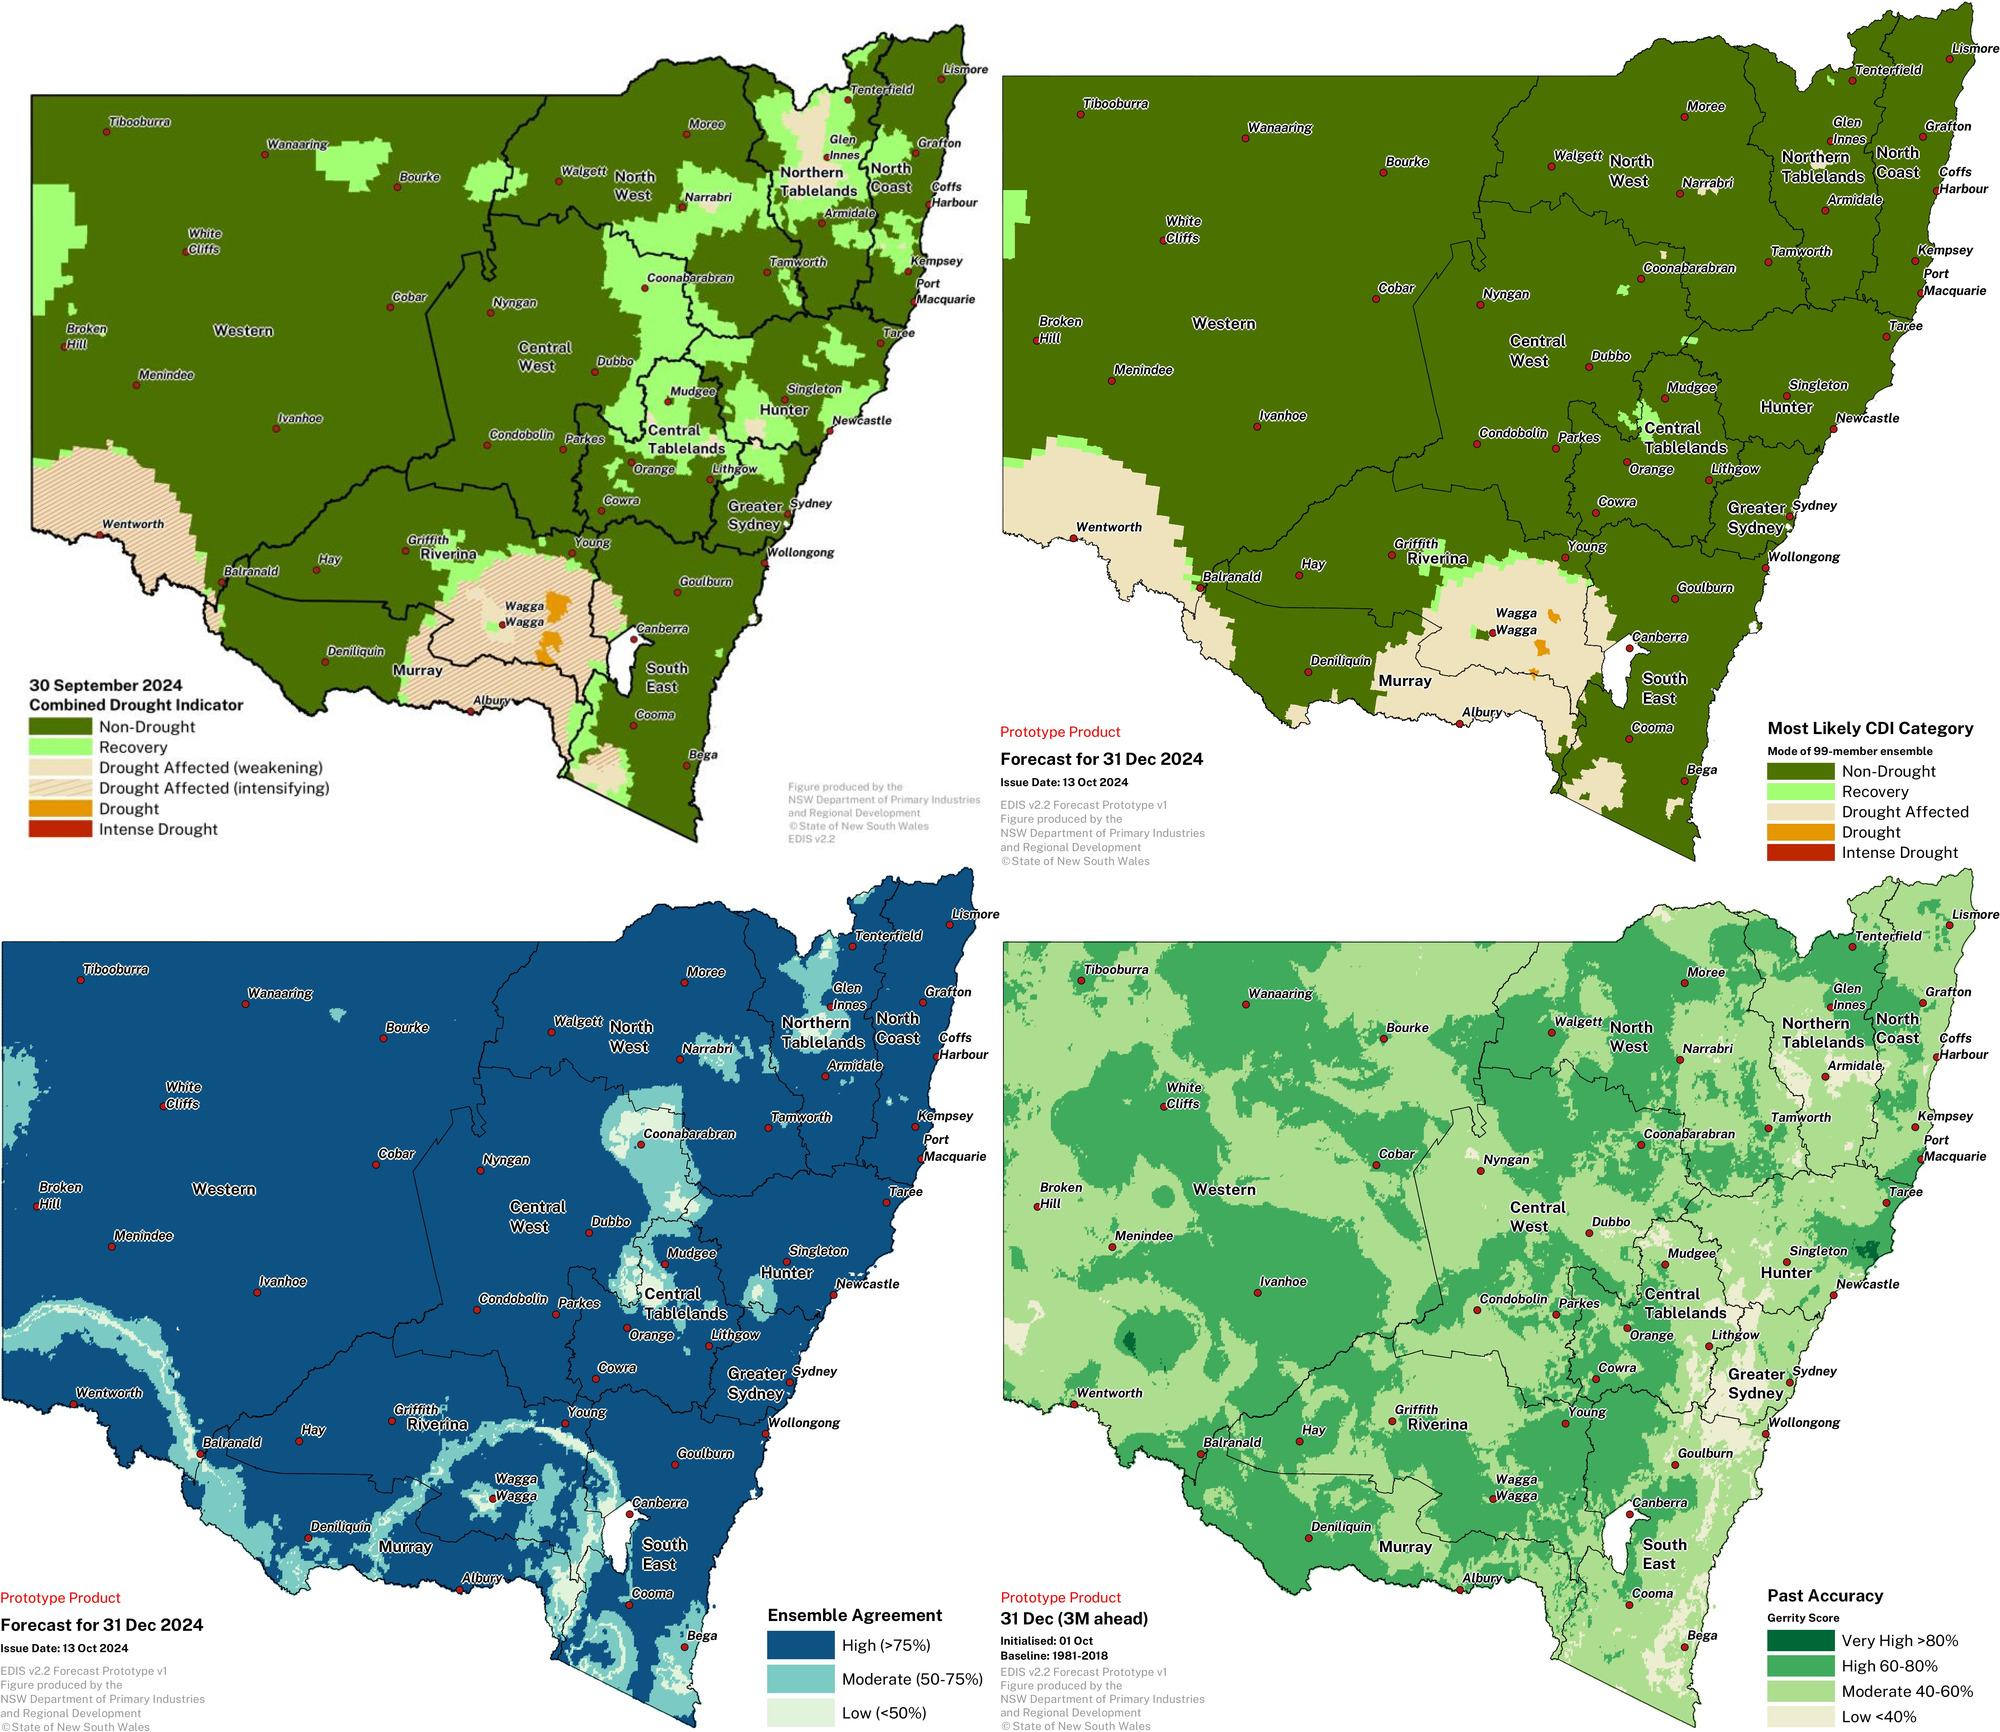
Understanding the DPIRD Drought Forecast
Most Likely CDI category
The DPIRD drought forecast for NSW presents the ‘Most Likely’ Combined Drought Indicator (CDI) category for the forecast period. The Most Likely CDI category is determined by identifying the 'mode' of the CDI ensemble. The mode is the category that appears most frequently across all possible forecast outcomes. It is the most common prediction for drought conditions in the forecast period based on the model's simulations.
This map can be used alongside the most current CDI map to observe current conditions and the most likely conditions in three months’ time.
Ensemble Agreement
Ensemble agreement refers to the level of consensus on the mode among the ensemble members. When there is high agreement, it means that most of model runs are predicting a similar CDI category, suggesting greater confidence in the forecast. If the agreement is low, it suggests that there is a wide range of possible outcomes, leading to greater uncertainty in the forecast.
Past Accuracy
Past accuracy refers to how closely previous forecasts matched the actual CDI categories that occurred for every forecast month in the historical record (1981 –2018), allowing an assessment of the reliability of the current forecast. If the model has consistently provided accurate predictions, there is more confidence in its current output. However, if past accuracy is low, it might suggest a need for more caution in interpreting the forecast, especially when ensemble agreement is low.
Technical Features
Variations in the skill tests
The maps of ensemble agreement and past accuracy display the general quality of the forecast signal across the state and over seasons, and they also display complex local spatial patterns. This is random noise due to several underlying factors including:
- the public skill analyses maps are displayed at the high-resolution calculation scale of the NSW CDI (1km2).
- local level complexity in the climate system such as storm tracks and convective processes, which are not adequately tracked at an individual event level in any forecast and also vary with season and location.
- error in both the observation and forecasts models.
- the categorical system used to classify these skill tests for users.
The short-range complexity has been retained in the current public release of the skill maps to provide decision makers with a detailed and transparent insight into the local properties of the forecast, so they can weight their use of the information accordingly. DPIRD is actively seeking feedback on this aspect of the system. General feedback on the forecast system can be provided by email at seasonal.conditions@dpird.nsw.gov.au.
Why use a climate model ensemble?
Forecast ensembles are generated by running the climate model multiple times with slightly different starting conditions. Forecasters produce ensembles to capture the range of possible realistic future scenarios. This provides a way to track the most likely outcome over a forecast period as well as estimate the uncertainty around that outcome in a complex system like Australia’s climate and weather.
The Bureau of Meteorology regularly updates the starting conditions of the ACCESS-S2 system using data assimilation, a technique that combines observations and numerical modelling. The Bureau use small semi-random perturbations, based on measurement errors, applied to the initial state of atmospheric variables (e.g., wind, pressure, and humidity) to generate the set of different starting conditions for the ensemble. This methodology has been proven to increase forecast accuracy and is used extensively in most climate forecast agencies around the world.
More information about forecast science is available in the soon to be release drought forecast technical report and linked resources.
Visit the NSW State Seasonal Update to view the current Drought Forecast.
