April 2025
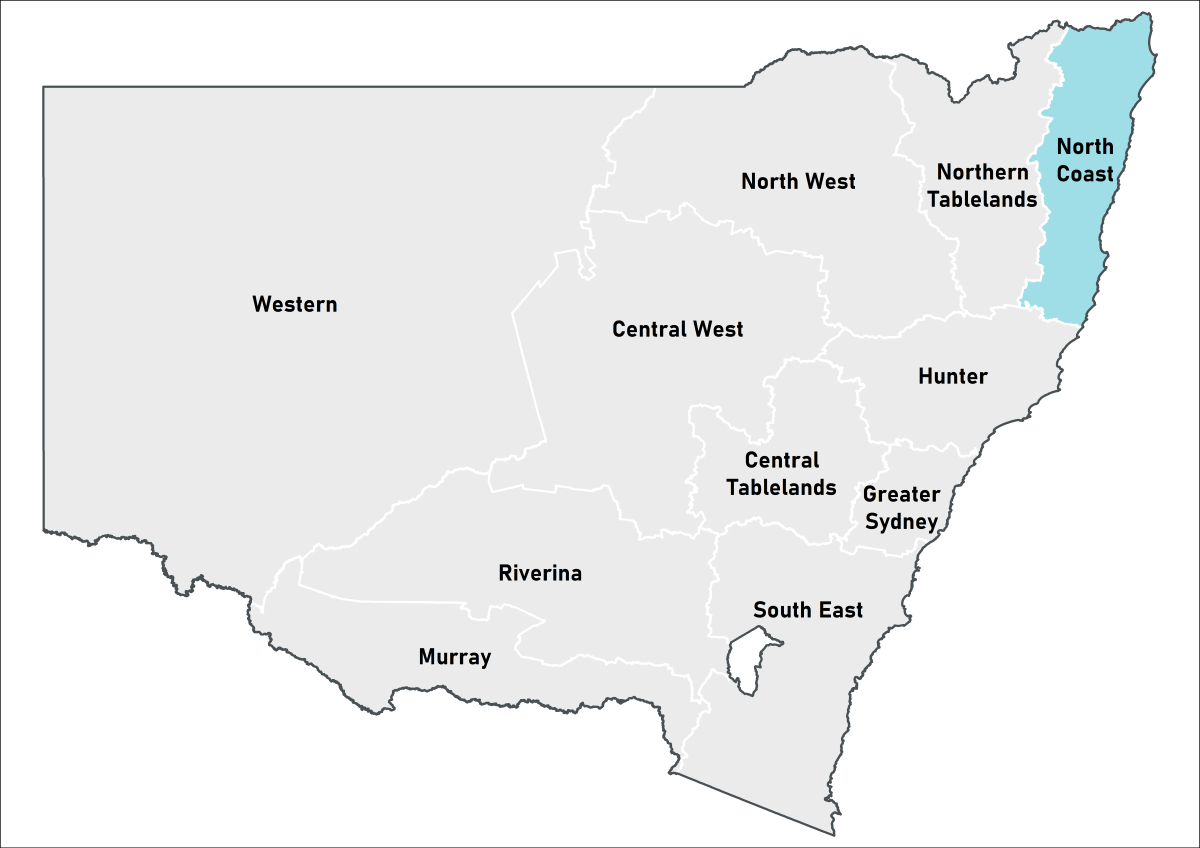 North Coast Local Land Services
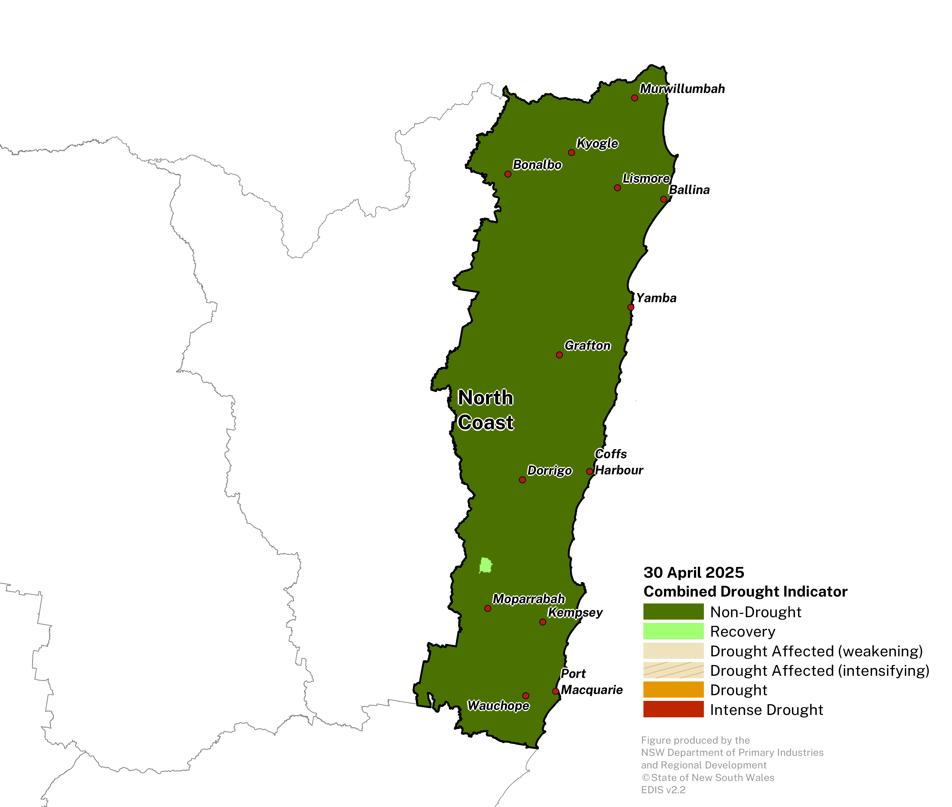
Positive production outlooks continue across the region.
- Most of the region remains in the NSW CDI Non-Drought category.
- Rainfall during April was above average. This will continue the positive production outlook for most of the region.
- The ongoing wet conditions for some coastal areas is continuing to impact livestock producers in lower lying areas.
- The drought forecast suggests that the region will likely be in the Non-Drought category by the end of July 2025 (with high model agreement and moderate to high past accuracy).
Click on the scroll bar below the map to compare with previous months.
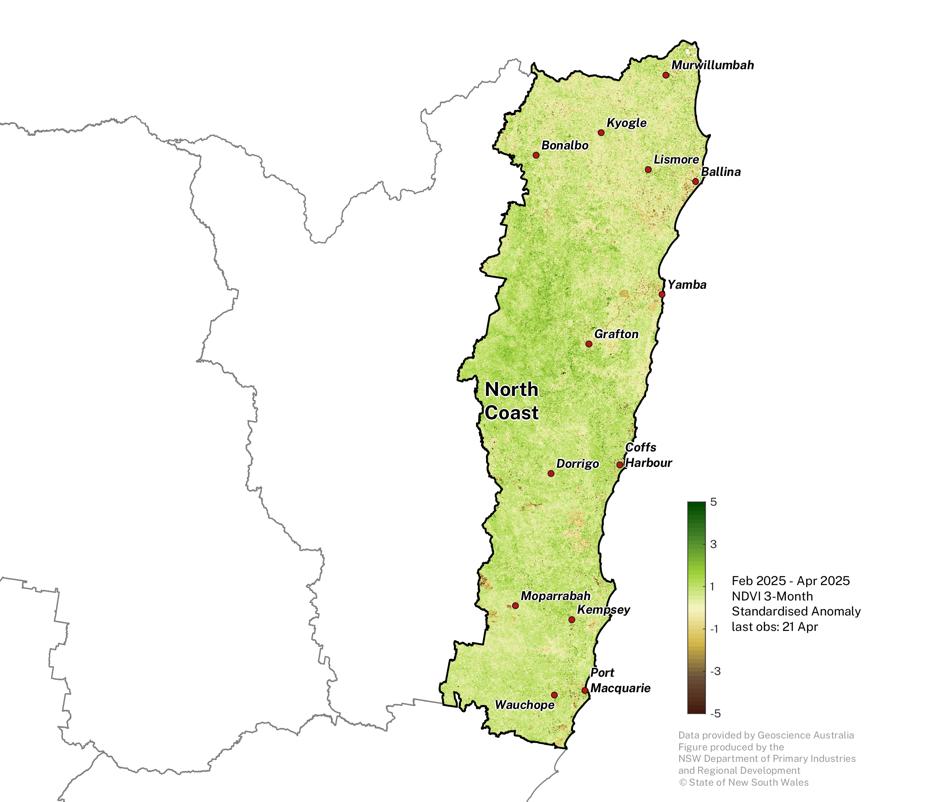
Normalised Difference Vegetation Index
Plant greenness levels remain near average to above average across most of the region for the February to April period.
- Below average anomalies may be due to recent flooding and waterlogging.
Note that some of the extremely negative NDVI areas (brown patches) are water bodies.
The NDVI anomaly is a useful measure of vegetation density and plant health. It estimates the amount of green vegetation there is in the landscape compared to what is expected at the given time of year, against the baseline period 1987 - 2020.
Click on the scroll bar below the map to compare with previous months.
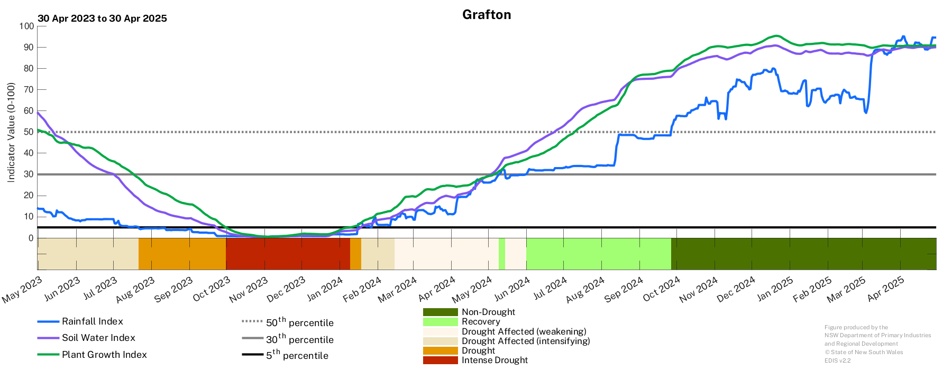
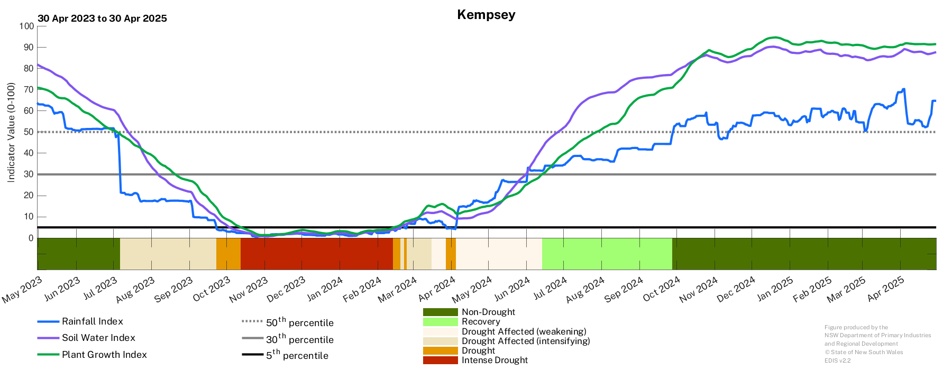
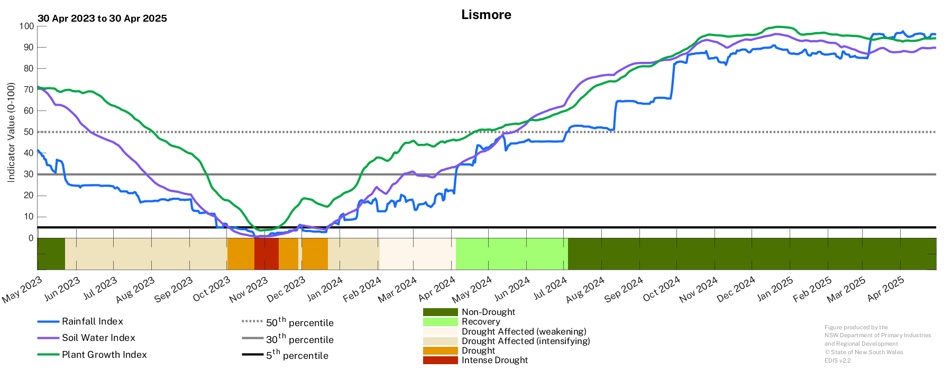
Individual Drought Indicators
The drought indicators respond to autumn rainfall events across all locations.
- Positive production outlooks for producers remain across the region.
To access a Drought History chart for your Parish, visit the Seasonal Conditions Information Portal.