

How to read the results
The table
| 1 | 2 | 3 | 4 | 5 | 3 | 6 | 7 | 8 | 9 | 10 | |||
|---|---|---|---|---|---|---|---|---|---|---|---|---|---|
| Bloodline | Code | GM/DSE (%dev) |
CFW (%) | FD (µm) | YLD (%) | FDST (µm/yr) | BWT (%) | Style | Length | Colour | Tender | No. of Teams | Acc.* |
| Bloodline A | 212 | 3.6 | 0.4 | -0.31 | 0.2 | 0.01 | -3.6 | 2.29 | 1.44 | 1.17 | 1.07 | 7 | H |
| Bloodline B | 47 | 3.2 | 2.5 | -0.41 | -0.4 | 0.00 | 2.8 | 2.25 | 1.37 | 1.19 | 1.09 | 12 | H |
| Bloodline C | 89 | -1.9 | 0.3 | -0.04 | -2.0 | 0.09 | -3.0 | 2.40 | 1.48 | 1.09 | 1.05 | 5 | M |
| Bloodline D | 1 | 2.6 | -3.8 | -0.61 | -0.9 | 0.01 | -3.2 | 2.28 | 1.38 | 1.14 | 1.07 | 64 | H |
| Bloodline E | 24 | 13.4 | 9.9 | -0.30 | 0.2 | 0.12 | 0.7 | 2.26 | 1.25 | 1.16 | 1.08 | 39 | H |
| etc | 87 | 0.2 | 6.0 | 0.07 | 0.2 | 0.12 | 1.9 | 2.30 | 1.36 | 1.13 | 1.05 | 4 | M |
| 11 | |||||||||||||
| Average | — | 16.6 | 4.6 | 22.10 | 73.9 | 0.67 | 51.4 | 2.29 | 1.39 | 1.12 | 1.07 | 13.4 | — |
| 12 | GM/DSE | Kg | µm | % | µm/yr | Kg | |||||||
| Av. Std. error (SE) | — | — | 2.3 | 0.25 | 0.5 | 0.13 | 2.1 | 0.06 | 0.06 | 0.05 | 0.04 | — | — |
* Accuracy: H = HIGH (SE for Fleece Weight of less than 2 percent), M = MODERATE (SE for Fleece Weight of 2-3 percent)
| 1 | Code: | This number is used to find the bloodlines on the graphs. |
|---|---|---|
| 2 | GM/DSE: | Bloodline gross margin per dry sheep equivalent expressed as percentage deviations from the average. Different micron premium markets are used to calculate values. |
| 3 | CFW & BWT: | Clean fleece weight and body weight expressed as percentage deviations from the averages. |
| 4 | FD & YLD: | Fibre diameter and yield expressed as deviations from the average. |
| 5 | FDST: | Annual change in fibre diameter with age expressed as a deviation in microns per year. |
| 6 | Style: | Spinners, best, good, average, and inferior grade (coded 1 to 5 respectively). |
| 7 | Length: | Long, medium and short length (coded 1 to 3 respectively) for micron type. |
| 8 | Colour: | No colour, light unscourable and medium unscourable (coded 1 to 3 respectively). |
| 9 | Tender: | Sound, part tender, tender and very tender (coded 1 to 4 respectively). |
| 10 | No. of Teams: | The number of wether teams representing that bloodline in the analysis. |
| 11 | Average: | Overall mean for that trait expressed in the units displayed beneath the average. |
| 12 | Av. Std. error: | Average standard error of bloodlines for that trait. |
The graphics
Figure 2. Bloodline deviations for clean fleece weight and fibre diameter
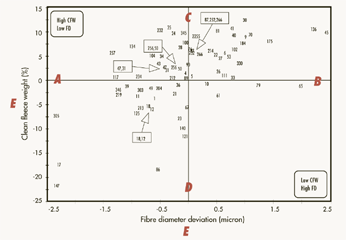 Graphs display the position of bloodlines based on two traits. For example, fleece weight (side) versus fibre diameter (bottom).
- A. Finer fibre diameter bloodlines are to the left of the graph.
- B. Broader fibre diameter bloodlines are to the right of the graph.
- C. Higher fleece weight bloodlines are at the top of the graph.
- D. Lower fleece weight bloodlines are at the bottom of the graph.
- E. Performance is expressed as deviation from the average.
