

NSW State Seasonal Update - October 2019
Prepared by NSW DPI Climate Branch
NSW overview
Dry and warm conditions during October 2019 increased the intensity of the drought event being experienced across New South Wales (NSW). For most parts of the state, the continuing drought event is now prolonged, exceeding 18-24 months or more in duration. Despite rain across some districts in early November 2019, the most likely scenario is for the state-wide drought event to continue over the coming summer, given rainfall forecasts and seasonal increases in temperature. Management of drought conditions will likely be required well into 2020, with consistent above average monthly rainfall needed to break the event.
The dry and warm conditions in October reduced the yield potential of winter crops growing in southern NSW, while there was no improvement to the summer crop outlook across the state. The recent rainfall event in early November may assist some crops in parts of the southern cropping zone, however this is dependent on crop stage and the amount of rainfall received.
October conditions have reduced spring pasture production across most of inland NSW. Many producers continue to manage feed-gaps, with little standing fodder of the quality needed to support livestock in many districts, particularly in the west and north of the state. The early November rainfall will produce some ‘green pick’ and germination of summer grasses, but follow up falls are required for a sustained recovery of the pasture base. In some regions, the November rainfall event will improve surface water supplies for livestock.
The NSW DPI Combined Drought Indicator (CDI) shows that 99.4% of the state remains in one of the three drought categories. Intense Drought persists in parts of the Central West, the North, the North-West and Far West of NSW. October rainfall totals were low for the majority of NSW, with large areas of western NSW having zero rainfall recorded for the month. The majority of eastern NSW received totals that were no more than 60% of the October average. The rainfall that was received was generally ineffective for crop and pasture production given high temperatures and evaporation rates, reflected in low values for the soil water and crop-pasture drought indicators. The available satellite data continues to track very low surface water supplies across large areas of NSW.
The Bureau of Meteorology (BoM) Climate Outlook released on 31 October 2019 indicates that NSW has a low to near equal chance of receiving median rainfall for the next three months, and therefore a low likelihood of the drought breaking during the remainder of the year. The outlook continues to be driven by a strong positive Indian Ocean Dipole (IOD) event, which is now likely to peak later than expected during November due to the late arrival of the monsoon trough. A positive IOD event is associated with dry conditions for central and southeast Australia and continues to be the dominant climate influence, as the El Niño forecast remains neutral for the remainder of 2019.
NSW received widespread rainfall in early November 2019, with the highest falls (80-100mm) recorded in parts of the north western and Riverina regions. This brings a degree of relief for many parts of NSW, but even in areas which had high totals this rainfall event was not drought breaking. For effective recovery from this drought, sustained falls over a few months will be required. While the event bought high totals in parts of the north-west and Riverina, it was variable across most districts. Other regions, such as the Northern Tablelands and parts of the far west, did not receive any rainfall.
Producers and members of rural communities are encouraged to maintain contact with their local professionals who can facilitate access to appropriate support. If you or someone you know needs support please visit DroughtHub. Alternatively, you can contact the DPI Rural Resilience Team, Rural Financial Counsellors, or your Local Land Services representatives.

It is important to recognise the CDI provides an aggregated view of the State, and that on-ground conditions can be different to those displayed in the maps. They provide an ‘on average’ view of a particular region only. To report local conditions use DPI Farm Tracker.
Drought Duration
Drought duration is widely recognised as an important component contributing to drought impact on farm businesses and communities. The drought duration map (Figure 2) shows the number of months since June 2017 that an area in NSW has been in any one of three CDI drought categories; Drought Affected, Drought or Intense Drought. The drought duration map indicates that as of 31 October 2019 large parts of NSW continue to experience long-term drought conditions for greater than 18 months.
*Note: The accumulated months reported in time of drought are non-consecutive.

Rainfall
October Rainfall
New South Wales (NSW) received well below average rainfall throughout October. The majority of the western areas of the state received totals of 0-10mm (Figure 3). Totals of 10-50mm were received in some areas further east, however these totals were no more than 20-60% of the October average depending on location. For the majority, this rainfall didn’t provide any relief to drought conditions.

Early November Rainfall Event
New South Wales experienced a widespread rainfall event in three days leading up to November 4. The distribution of the rainfall was variable across the state and within many regions (Figure 3b). Despite some higher totals, there were areas of the state that remained comparatively dry during this event. This includes:
- the North Coast and Northern Tablelands extending to the east of the Hunter and Northern Local Land Services (LLS) regions;
- the far west of the Western LLS region; and
- small areas in the Central West (south of Condobolin) and South East (east of Goulburn) LLS regions.
The rainfall event provides a degree of relief from the drought, but even in areas that received high totals, this should not be considered drought breaking. For a strong recovery to take hold across NSW sustained widespread rainfall over some months is required.
Higher totals of 25-100mm were received in the northern parts of the Western Local Land Services (LLS) Region. North western parts of the Central West and isolated areas in the eastern Riverina and Murray LLS regions also received larger totals of 25-50mm. Some of these totals were the highest recorded in several months and may provide some initial relief to conditions. Follow-up rainfall will be required to initiate the potential of early stage drought recovery and will be required in the short term as summer rapidly approaches.
Large areas of the state received totals of 10-25mm. This may provide some short term relief, however the initial stages of drought recovery is unlikely without adequate follow up rainfall. Some parts of the Central Tablelands may experience some opportunistic short term pasture growth in areas where there was a higher degree of existing ground cover.
There were significant areas of the state, including the North West, Far West and parts of the Central West, South East and Hunter that received small totals of <15mm. These areas will not receive relief from enduring drought conditions and the intensity of conditions is likely to increase. In some areas further south, there may be some benefit to winter crop yields, however this is dependant on crop stage and the amount of rainfall received.

Temperature
October daytime temperatures (Figure 4) ranged between 27-33°C across much of northern and central NSW. Temperatures were cooler at the higher altitudes in the Northern and Central Tablelands ranging between 21-24°C. Daytime temperatures for the coastal region north of Sydney, the Hunter and parts of the Riverina and Murray regions received daytime temperatures of 24-30°C, while the southern coastal regions and southeast NSW the temperatures ranged between 18-24°C. For parts of the southern slopes and areas closer to the Victorian border temperatures ranged between 24-17°C, while the alpine regions at higher altitudes received cooler temperatures between 15-18°C. The state’s interior experienced warmer than average daytime temperatures of 2-5°C during October. Coastal regions were also 1-2°C warmer than average.
Overnight temperatures (Figure 5) in large parts of north western and northern coastal regions of NSW ranged between 12-18°C. The majority of the slopes regions across the state, as well as parts of southern NSW experienced overnight temperatures ranging between 9-12°C. Areas in the Central Tablelands, South East and eastern Riverina and Murray regions received average overnight temperatures between 3-9°C. Alpine regions were cooler with temperatures between 0-3°C experienced.


Normalised Difference Vegetation Index (NDVI) Anomaly
The Normalised Difference Vegetation Index (NDVI) anomaly (Figure 6) shows that plant greenness levels continue to remain well below the long term levels expected during October across most of NSW. The NDVI is an index that provides a measure of vegetation density and condition. The NDVI anomaly is the deviation of the current NDVI from the long-term average for this time of year.
Note, The Bureau of Meteorology (BoM) issued a Service Caution Notice this month as follows: From March 2019, and possibly earlier, NDVI data have shown lower values in southern Australia due to a drift in the source NOAA satellite. The issue is being investigated and we expect corrections to be made in the coming two months. In the interim, please note the data may have a low (brown) bias and should be used with caution.

Farm Dam Water Status
The available satellite data indicates that farm dam levels remain low across the majority of NSW (Figure 7). Dry October conditions have seen low input and higher than expected evaporative losses from surface water. Surface water availability remains a critical factor for fam management as summer approaches.
DPI and Geoscience Australia monitor 67,000 farm dams each month by satellite and report average information for each parish (Figure 7).

Significant Events
Heightened Dust Activity
Dust activity has been increasing in recent months as outlined in the NSW Environment Energy and Science (EES) DustWatch reports. While the data for the October Dustwatch report has not been finalised, there is on-ground reports indicate that dust activity during the month was high and it is expected that the monitoring data for dust activity will far exceed the values obtained in September. Large areas of low ground cover in response to extended periods of dryness are likely to continue the risk of heightened dust activity for at least the short-term.
As the risk of heightened dust activity increases, it is important to remain vigilant in regards to possible health risks associated with dust exposure. The NSW Department of Health has provided a brief overview of health effects and precautions relating to dust exposure.
Access further information and subscription services relating to the NSW EES Dustwatch report. The October edition the DustWatch report is scheduled to be available in the second half of November.
Soil Water Index
The Soil Water Index (Figure 8, SWI) remains below average to extremely low across the majority of NSW. Continued widespread dryness throughout October contributed to the drying of soil moisture since September.
 to 31 October 2019")
Plant Growth Index
There was little improvement to the Plant Growth Indicator (Figure 9, PGI) during October, highlighting the continuation of dry conditions. The majority of NSW is experiencing below average to extremely low plant growth relative to the long term data.
 to 31 October 2019")
Rainfall Index
Dry conditions during October caused no notable improvements to the Rainfall Index (Figure 10, RI). The majority of the state remains below average to extremely low following very dry conditions during spring.
 to 31 October 2019")
Drought Direction Index
The majority of NSW experienced a drying trend during October as indicated by the Drought Direction Index (Figure 11, DDI). This highlights the continuation of widespread dryness during Spring in addition to the dry conditions occurring throughout winter.
 to 31 October 2019")
Changes in the individual drought indicators may have occurred since this update was released. For the most current information, please visit DroughtHub.
CDI status for the regions
Figure 12 displays the CDI status for each individual Local Land Services region to 31 October 2019.

Murray and Riverina regions
The Murray and Riverina Local Land Services (LLS) regions continue to experience widespread drought conditions. The Combined Drought Indicator (CDI, Figure 13) shows that the majority of this region is classified as being in the Drought or Drought Affected categories. October rainfall was insufficient to prevent further crop yield decline and decreasing feed potential across large parts of the region.
The monthly NDVI anomaly data (Figure 14) indicates that the region continues to be experiencing below normal levels of greenness. Poor agronomic activity has resulted from below average rainfall since winter.
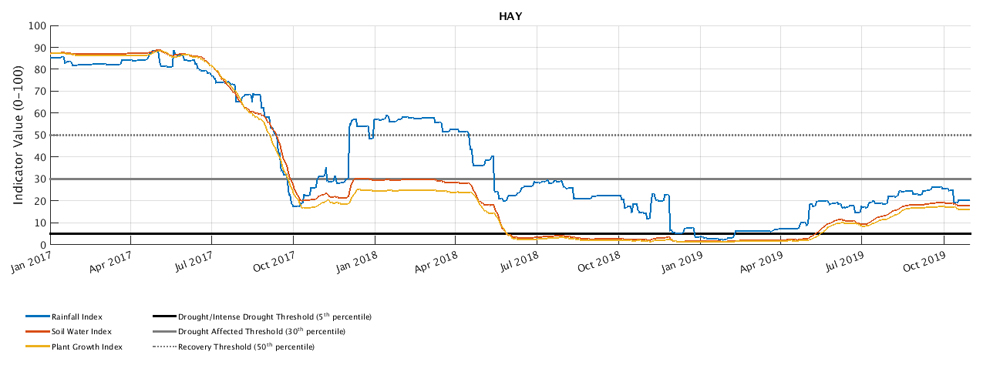
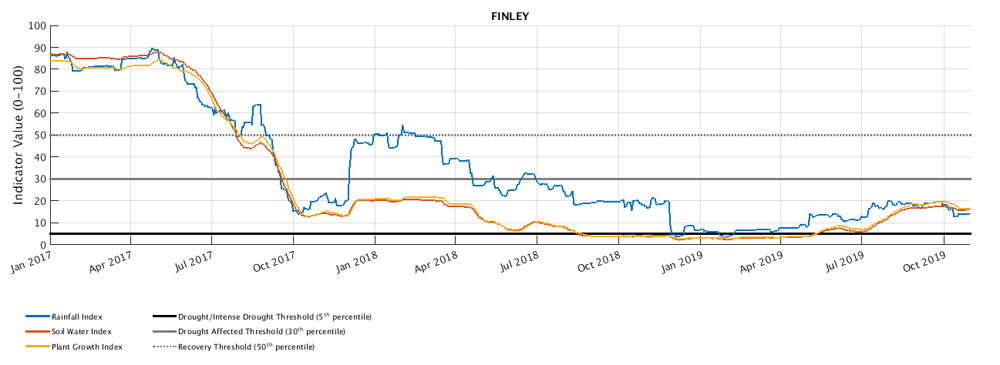
The time series charts (Figure 15) shows the individual response of the drought indices for Hay, Finley and Temora. The charts show that there were some beneficial periods of rainfall since May, however this hasn’t been adequate enough to prevent drought conditions being experienced. At the end of October, there has been little improvement to conditions and reflects the diminishing potential of crop yields and pasture growth in much of the region.


Western region
Drought conditions intensified in the Western Local Land Services (LLS) region during October. The Combined Drought Indicator (CDI) shows the whole region as being in one of the three drought categories of Drought Affected, Drought or Intense Drought (Figure 16). The entire region continues to experience the continuation of poor on-ground conditions with no relief experienced during early to mid Spring.
The monthly NDVI anomaly data (Figure 17) shows below normal levels of greenness compared to the long term expectations. This has been driven by poor agronomic activity due to insufficient rainfall during winter and spring. It is important to recognise that producers in the west and far west are managing total grazing pressure along with the dry meteorological conditions. For this reason in-field conditions may not always be reflected in the CDI maps, and it is important to cross reference them with satellite data.
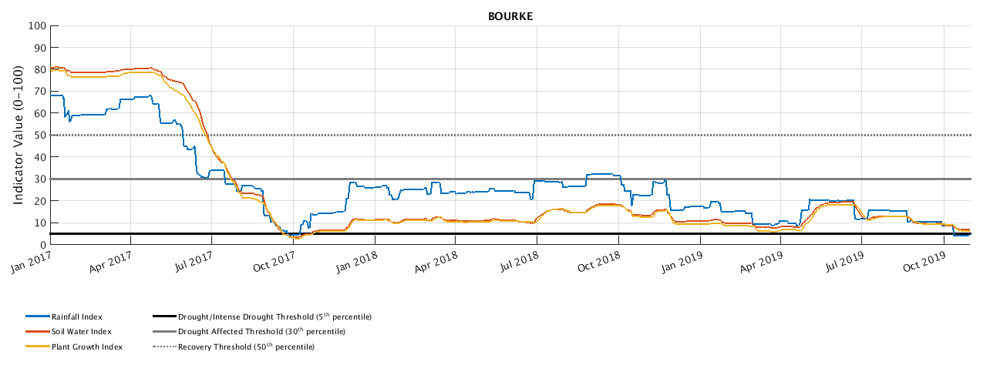
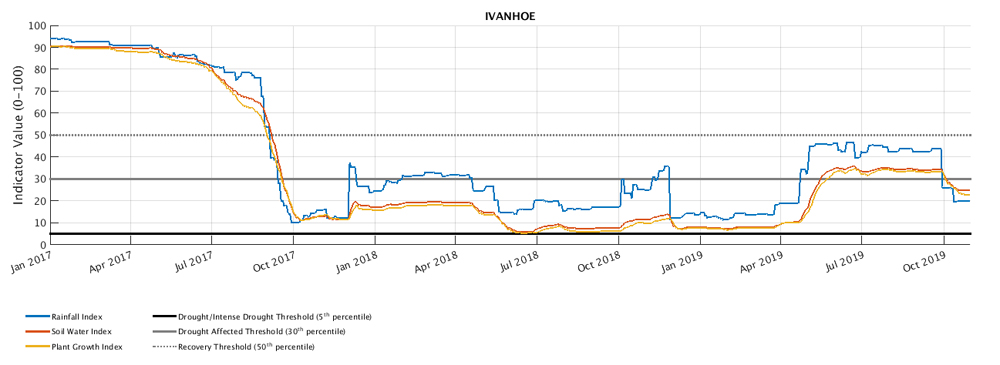
The time series charts (Figure 18) showing the individual response of the drought indices for Bourke, Ivanhoe, and Wentworth reflect the variation between locations. Despite not being drought breaking, Bourke experienced a positive shift in the indices during April and May. This was short lived with the indices declining due to the lack of follow up rainfall. Ivanhoe experienced similar relief in April and May but with a slightly greater magnitude initiating a short-term period of recovery before declining again during October. Wentworth has experienced a longer period of time where the drought indices have struggled to surpass the lowest 10th percentile. There has been little if any relief to drought conditions for a long period of time.


North West, Northern Tablelands and North Coast regions
Drought conditions continue to impact the entire northern area of NSW with the Combined Drought Indicator (CDI) showing the region to be in one of the three drought categories of Drought Affected, Drought or Intense Drought (Figure 19). The area categorised as Intense Drought has expanded and field reports confirmed the severity of drought conditions across the region.
The monthly NDVI anomaly data (Figure 20) shows that the region is experiencing the continuation of below normal levels of greenness compared to the long term expectations. This reflects the insufficient rainfall over several months resulting in poor agronomic activity.
The time series charts (Figure 21) showing the individual response of the drought indices for Moree, Walgett and Tenterfield reflect the long term trend of the drought indices tracking in the bottom 5th percentile of the historic range. There was a small positive rainfall shift at Tenterfield in early 2019, but the effectiveness of this rainfall was poor as indicated by the lack of response in the soil moisture and plant growth indices. All three locations show extremely low rainfall indices for the majority of 2019 and highlights the ongoing intensity and duration of drought conditions occurring in northern NSW.


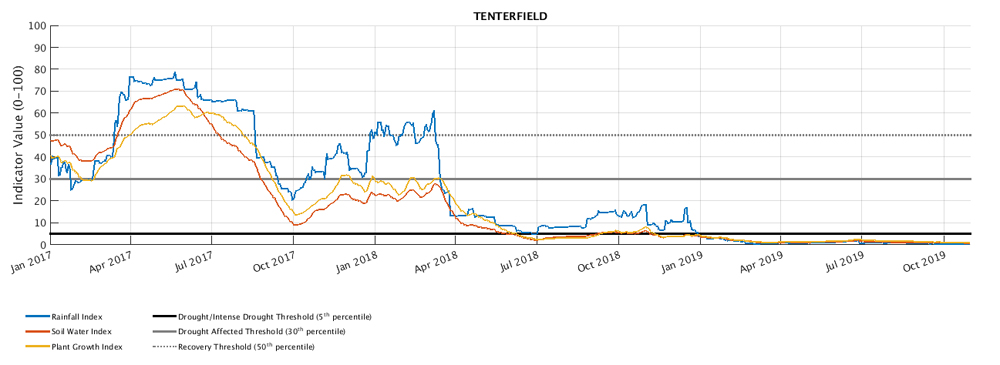
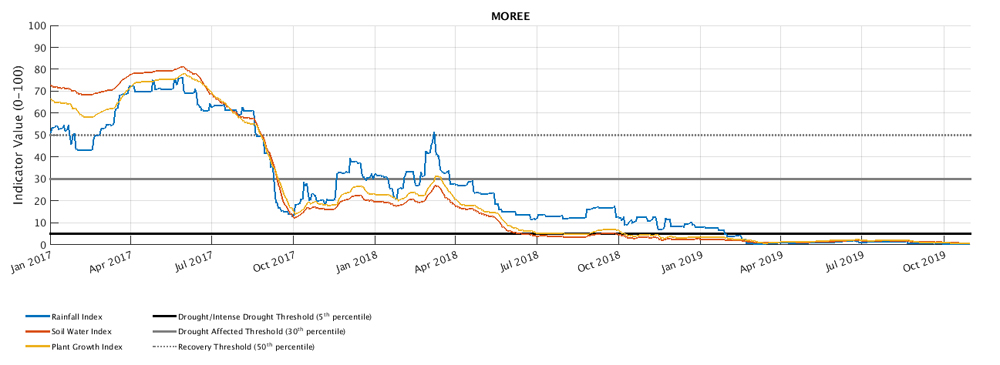
 and North West (Moree and Walgett).")
Central Tablelands, Central West, Hunter and Greater Sydney regions
The majority of the Central Tablelands, Central West, Hunter and Greater Sydney Local Land Services regions (LLS) continue to experience drought conditions. The Combined Drought Indicator (CDI) shows that most of the area remains categorised in either the Drought Affected, Drought or Intense Drought categories (Figure 22). Conditions in the Central West and the Hunter LLS regions have intensified, with the CDI showing a widespread transition into the Drought and Intense Drought categories. The CDI also shows that conditions in the Central Tablelands LLS remained relatively stable since the September State Seasonal Update and continued follow up rainfall is needed to see an improvement in conditions..
The monthly NDVI anomaly data (Figure 23) shows the continuation of below normal levels of greenness compared to the long term expectations. This has been driven by insufficient rainfall and poor agronomic activity over recent months.
The time series charts (Figure 24) show the individual response of the drought indices for Cowra, Condobolin and Singleton. Drought conditions have impacted all locations for an extended period of time, however the charts show some variation in the nature of the drought between the locations. There have been periods of short term relief at Singleton since February, however this has been short lived due to the lack of follow up rainfall during winter, as reflected in the declining indices. The importance of follow up rainfall can also be observed at Cowra, where the rainfall that has been received has largely been ineffective on soil moisture and plant growth. The duration and intensity of conditions at Condobolin have been far more severe, with the drought indices all tracking below the bottom 5th percentile for the last twelve months.


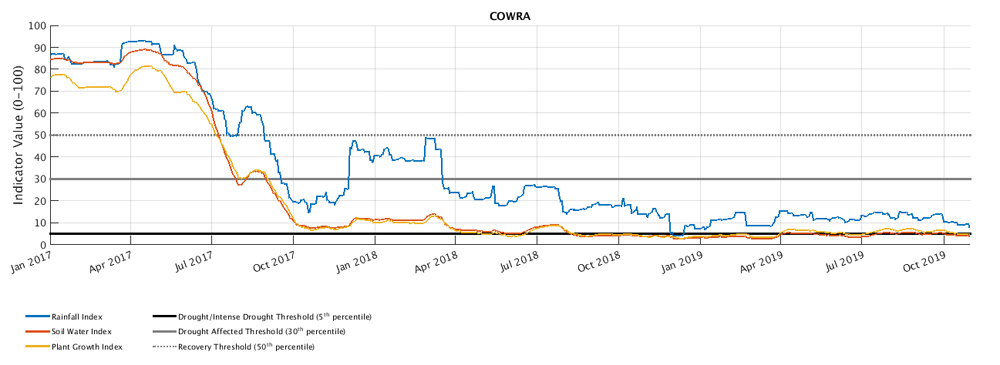
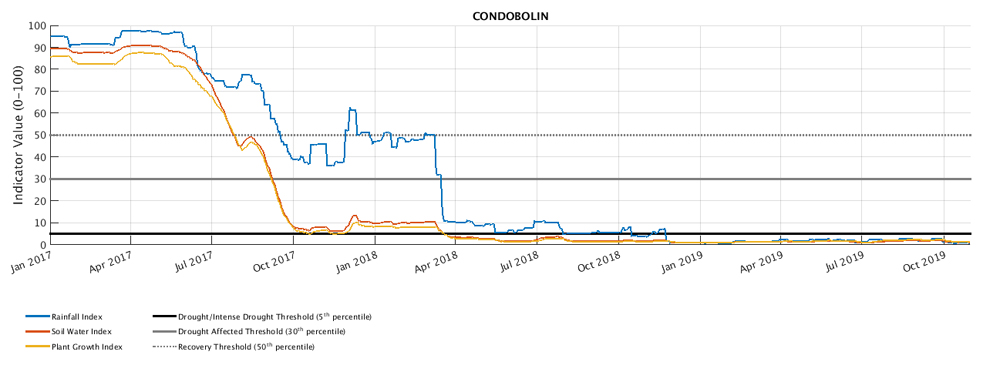
, Central West (Condobolin), and Hunter (Singleton).")
South East region
The majority of the South East Local Land Services (LLS) region is classified as either Drought Affected (intensifying) or Drought as shown by the Combined Drought Indicator (CDI) (Figure 25). Low winter rainfall resulted in the majority of the region starting with a poor base in Spring and despite some isolated rainfall occurring across the region in September, it has not been enough to prevent the intensification of conditions.
The monthly NDVI anomaly data (Figure 26) indicates widespread below normal levels of greenness compared to the long term expectations. This has been driven by poor agronomic activity over the past few months and insufficient rain to encourage sustained agronomic growth. This also indicates that the isolated rainfall experienced in September didn’t shift plant levels back towards an expected level during October.
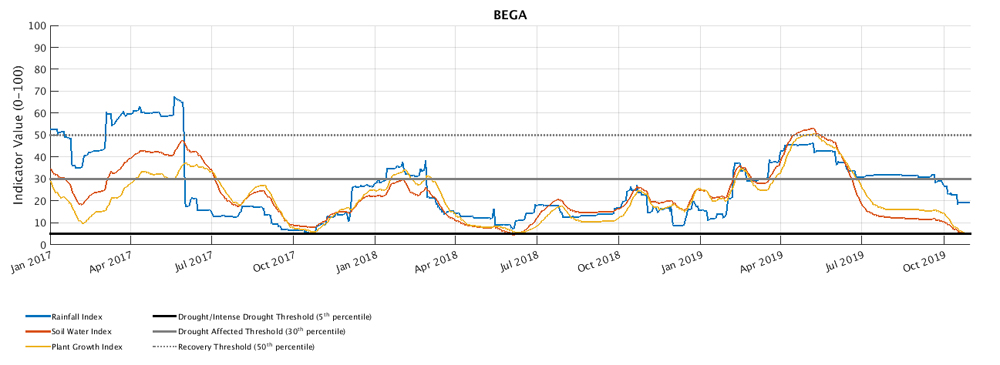
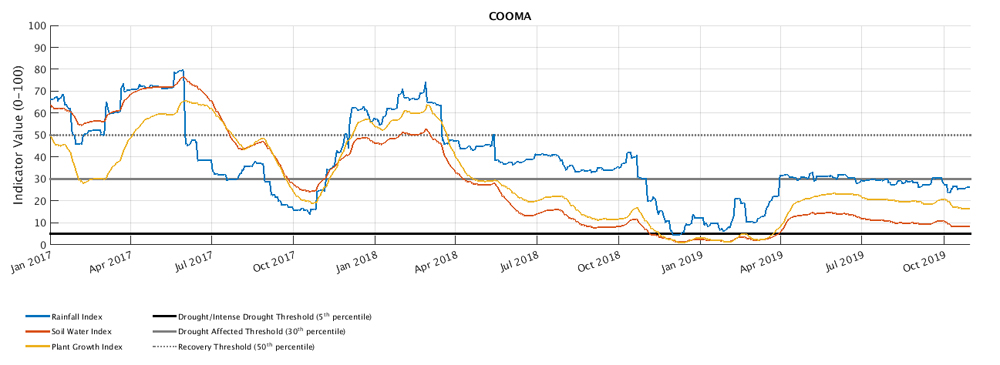
The time series charts (Figure 27) show the individual response of the drought indices at Bega, Goulburn and Cooma. Of the three locations, Bega experienced the greatest amount of relief with a short term recovery occurring between March and June before rapidly falling below drought thresholds in July. This false recovery highlights the need for sustained follow up rainfall to create confidence of longer term drought recovery. Both Goulburn and Cooma received some meteorological relief with rainfall occurring from April, however this rainfall has been ineffective for driving soil water and plant growth indicators above the lowest 20th percentile of the long term historical data. At the end of October, any recent rainfall has failed to provide any relief with conditions intensifying across the majority of the region.


Official national outlook
The official National Climate Outlook for November to December was released by the Bureau of Meteorology (BoM) on 31 October 2019. Rainfall is likely to be below average across most of Australia for the remainder of 2019. The summer (December to February) outlook is far more neutral, however most of eastern Australia remains likely to be drier than average. Despite an easing in the outlook for some areas in coming months, it should be noted that several months of above average rainfall would be needed to see a recovery from current long-term rainfall deficiencies.
NSW outlook
The majority of New South Wales (NSW) is forecast to have a low chance of receiving median rainfall during the next three months, with some parts of western NSW having a near equal chance of receiving drier or wetter than average conditions. The historical rainfall outlook accuracy at this time of year is moderate to high for most of NSW with the exception for the Hunter and parts of the Northern Tablelands and North West regions where the accuracy is low.

The BoM temperature outlook for November to January (Figures 29 & 30) indicates a high chance of warmer than average daytime temperatures occurring across all of NSW. Overnight temperatures are also forecast to have a higher chance of being warmer than average for most of NSW, however south western areas of the state have a near equal chance of experiencing warmer or cooler than average overnight temperatures.


Climate drivers
El Niño–Southern Oscillation (ENSO)
The Bureau of Meteorology’s (BoM) El Niño–Southern Oscillation (ENSO) Outlook was released on 29 October 2019. The majority of climate models forecast neutral ENSO for the remainder of 2019 and into the first quarter of 2020. Most of the atmospheric indicators are also neutral, with the exception of the Southern Oscillation Index, which is currently negative.
When ENSO is neutral, it has little effect on Australian and global climate, meaning other influences are more likely to dominate. Currently the strong positive Indian Ocean Dipole (IOD) event continues to remain as the dominant influence on weather patterns into summer.
Southern Oscillation Index
The 30-day Southern Oscillation Index (SOI) for the 30 days ending 27 October 2019 was -5.2. The 90 day value was -7.8. Atmospheric pressure continues to remain high over Darwin, however this has weakened compared to recent weeks and the SOI is currently in the neutral range.
Sustained negative values of the SOI below −7 typically indicate El Niño while sustained positive values above +7 typically indicate La Niña. Values between +7 and −7 generally indicate neutral conditions.
 to 27 October 2019")
Sea surface temperatures
Monthly sea surface temperatures for October were about average in the central Pacific, warmer than average in the western Pacific, and cooler than average in the eastern Pacific. Ocean temperatures off the north coast of Australia were cooler than average, extending into the eastern Indian Ocean. Cooler waters in the eastern Indian Ocean commonly occur during a positive Indian Ocean dipole.The latest values of the three key NINO indices in the tropical Pacific for the week ending 27 October are: NINO3 +0.4°C, NINO3.4 +0.7°C and NINO4 +1.0°C. Persistent NINO3 or NINO3.4 values warmer than +0.8 °C are typical of El Niño, while persistent values cooler than −0.8 °C typically indicate La Niña.
")
Sea Sub-surface Temperatures
The four-month sequence of equatorial sub-surface temperature anomalies (to 24 October) shows cool anomalies in the western equatorial Pacific, at a depth of around 100 to 200 m, and in the shallow sub-surface east of 110°W between 0 to 100 m depth. Weak warm anomalies extend across most of the top 200 m in most of the remainder of the equatorial Pacific.
")
Indian Ocean
The Indian Ocean Dipole (IOD) remains strongly positive, with the latest weekly index value to 27 October at +2.06 °C. This is the second highest weekly value observed in the Bureau's dataset, which commenced in 2001. The highest value of +2.15 °C was observed two weeks ago.
A positive IOD often results in below average winter–spring rainfall over southern and central Australia. It also typically means warmer than average winter–spring days for the southern two-thirds of Australia. Positive IOD events are often associated with a more severe fire season for southeast Australia.
The very strong positive values of the IOD are due to the strong temperature gradient across the Indian Ocean. SSTs to the south of the Indonesian islands of Sumatra remain more than 2 degrees cooler than average for the week ending 27 October, while warm anomalies close to the Horn of Africa reach between 1 and 2 degrees warmer than average.
The overall pattern of sea surface temperatures has remained generally consistent with a positive IOD pattern since late May and all six international climate models surveyed by the Bureau indicate the IOD will remain positive into December.
The retreat of the Southwest Indian Monsoon was very slow this year, and models are indicating a slower break down of the IOD than usual. Despite this, it remains unlikely that the positive IOD will persist into the second half of summer. IOD events dissipate as the monsoon trough moves into the southern hemisphere. This changes the broadscale wind patterns over the IOD region and typically returns sea surface temperatures to near average.
Southern Ocean
The current index for the Southern Annular Mode (SAM) is currently strongly negative and is expected to become increasingly negative over the next two weeks. A negative SAM in mid-to-late spring contributes to warmer daytime temperature, lower rainfall, and higher wildfire risk. The negative SAM has less influence on overnight temperatures.
How does it work?
Much of the information in the Seasonal Conditions Report is sourced from the NSW DPI Enhanced Drought Information System (EDIS) ™. The EDIS system is currently available in prototype form and is subject to an intensive ground truthing process. For more information, visit the interactive website via DroughtHub.
EDIS is an ongoing project aimed at improving the quality and timeliness of efforts to monitor conditions across the state. Key features of the system are:
- It tracks drought by using four indicators; rainfall, soil water, plant growth, as well as tracing rainfall trends. Agronomic conditions have equal value to rainfall recorded at meteorological stations.
- The Combined Drought Indicator (CDI) brings this information together, and has been designed to characterise developing drought conditions. The key purpose for building the CDI was as a drought early warning system.
- The rainfall, soil moisture and plant growth indicators in EDIS account for conditions over a 12 month window. This provides a compromise between a highly sensitive indicator (e.g. six months) and a less sensitive indicator (e.g. 24 months).
- Climate and remote sensing data drive the information system at a high resolution, but the CDI is reported at a Parish level.
- Because of its configuration and purpose, there will be differences to the indicator used in the National Drought Monitoring Framework (the Australian Rainfall Deficiency Analyser) which relies on rainfall alone.
- The CDI has three drought categories that characterise NSW according to drought intensity as well as the main drivers of a drought event (meteorological, hydrological and agronomic). DPI considers areas Drought Affected to be experiencing a drought event.
- The Drought Affected category encompasses a wide range of conditions from the very early stages of drought entry through to a drought event becoming intense. This enables the drought monitoring system to detect a drought event early. It is also possible to stay in the Drought Affected category for some period of time.
The way in which the indicators are combined to form the CDI is described in Table 1 below.
Table 1: Description of the Combined Drought Indicator framework
CDI Phase | Technical definition | Description - typical field conditions |
|---|---|---|
Intense Drought | All three indicators (rainfall, soil water, plant growth) are below the 5th percentile | Ground cover is very low, soil moisture stores are exhausted and rainfall has been minimal over the past 6-12 months. |
Drought | At least one indicator is below the 5th percentile | Conditions may be very dry, or agronomic production is tight (low soil moisture or plant growth). It is possible to be in Drought when there has been some modest growth, or a few falls of rain. |
Drought Affected (intensifying) | At least one indicator is below the 30th percentile and the rainfall trend is negative over the past 90 days. | Conditions are deteriorating; production is beginning to get tighter. Ground cover may be modest, but growth is moderate to low for the time of year. When indicators are close to the Drought threshold drought conditions are severe. |
Drought Affected (weakening) | At least one indicator is below the 30th percentile and the rainfall trend is positive over the past 90 days. | Production conditions are getting tighter, but there have been some falls of rain over the past month. It is rare to enter the Recovering phase from the Non-Drought category; Usually there is a quick (1-2 week) transition into Drought Affected or Drought. When indicators are close to the Drought threshold drought conditions are severe. |
Recovering | All indicators are below the 50th percentile but above the 30th percentile | Production is occurring but would be considered ‘below average’. Full production recovery may not have occurred if this area has experienced drought conditions over the past six months. |
Non-drought | At least one indicator is above the 50th percentile. | Production is not limited by climatic conditions. |
The NSW State Seasonal Update is provided each month by the NSW DPI Climate Unit, which is part of the Livestock Systems Branch in DPI Agriculture.
Information used in this report was primarily sourced from the Australian Bureau of Meteorology, the US National Oceanic and Atmospheric Administration, the International Research Institute for Climate and Society (Columbia University), Geoscience Australia’s Digital Earth Australia Program, and NSW Department of Primary Industries.
Maps in this document contain data which is © Spatial Services – NSW Department of Finance, Services and Innovation (2019), Panorama Avenue, Bathurst 2795 and data which is © Commonwealth of Australia 2019, Australian Bureau of Meteorology, Melbourne. All rights reserved.
The seasonal outlooks presented in this report are obtained from the Australian Bureau of Meteorology and other sources (including World Meteorological Organisation Global Producing Centres). These outlooks are general statements about the likelihood (chance) of (for example) exceeding the median rainfall or minimum or maximum temperatures. Such probability outlooks should not be used as categorical or definitive forecasts, but should be regarded as tools to assist in risk management and decision making. Changes in seasonal outlooks may have occurred since this report was released.
All climate and remote sensing input data is supplied to the Enhanced Drought Information System ™ under the Australian Creative Commons Licence (CCY 4.0) and is made available by the Terrestrial Ecosystem Research Network
© State of New South Wales through the Department of Industry, Skills and Regional Development, 2019. You may copy, distribute and otherwise freely deal with this publication for any purpose, provided that you attribute the NSW Department of Primary Industries as the owner.
Disclaimer: The information contained in this publication is based on knowledge and understanding at the time of writing (November 2019). However, because of advances in knowledge, users are reminded of the need to ensure that information upon which they rely is up to date and to check currency of the information with the appropriate officer of the Department of Primary Industries or the user’s independent adviser.
Published by the NSW Department of Primary Industries. ISSN 2202-1795 (Online). Volume 7 Issue 10.
