

NSW State Seasonal Update - April 2019
Prepared by NSW DPI Climate Unit
NSW overview
Prolonged and widespread drought conditions continued for the majority of New South Wales (NSW) throughout April, with only isolated areas in drought recovery. Despite some moderate to high rainfall events across the state, rainfall totals throughout April were generally inadequate to lift the state out of drought conditions.
On the 3-5 May 2019 a significant rainfall event bought 25-100mm to the west, north-west and south of the state. While this is an easing of conditions in these areas, as it is timely for sowing winter crops and should relieve stock water stress, it does not represent a full break from drought at this stage.
The intensity of drought conditions across NSW are varied, with the far west and north of the state continuing to experience severe conditions. Producers continue to manage feed deficits and water shortages, while critical winter crop sowing and winter feed gap periods rapidly approach in the northern cropping belt and northern tablelands. Isolated areas on the south coast and in the central and southern tablelands continued early stages of drought recovery following a more consistent pattern of rainfall since January 2019. Despite this, recovery rates have slowed due to dry April conditions and the onset of cooler overnight temperatures. Further rainfall is required to maintain the recent agronomic improvement.
The NSW DPI Combined Drought Indicator (NSW CDI) provides a general regional assessment of the complex pattern of field conditions across NSW. The CDI showed some shifts in the nature of the current drought however the challenging agronomic and hydrological conditions remain ongoing for most of the state. Overall the CDI is unchanged since the March State Seasonal Update (SSU) with 99% of NSW in one of the three drought categories.
Rainfall totals received across NSW in April were highly variable. There was little follow up rain for the areas that received higher March totals and while conditions have shown some improvement in these regions, the effectiveness of this rainfall has been reduced due to the dry April conditions.
However, some areas in the western half of the state did receive higher rainfall totals during April than in March, though the distribution of this rainfall was highly variable. While the rainfall was welcomed in these areas, it does not constitute a break from drought conditions. It will take a number of weeks to assess the agronomic impact of the falls, and more follow-up rainfall is needed to ensure that any improvement is sustained.
Official climate forecasts released on 26 April from the Bureau of Meteorology (BOM) indicate a near equal chance of wetter or drier than average conditions over the coming three months, and the temperature outlook indicates a high chance of warmer than average temperatures across all of NSW. The latest ENSO Outlook issued by the BOM on 30 April 2019 remains at El Niño Alert with approximately a 70% chance of an El Niño developing in 2019.

It is important to recognise the CDI provides an aggregated view of the State, and that on-ground conditions can be different to those displayed in the maps. They provide an ‘on average’ view of a particular region only. To report local conditions use DPI Farm Tracker.
Rainfall
April rainfall totals were varied across NSW in April (Figure 2). The North Coast region experience the greatest falls, receiving between 100 to 200mm. For other parts of NSW, totals ranged between 10-100mm, except for parts of Western and Central West LLS regions that experienced between 0-10mm of rain. Despite similar rainfall totals in the west and east of the state, rainfall anomalies were highly positive in the west, and highly negative in the east.

Temperature
Daytime and overnight temperatures were warmer than average across the state during April (Figure 3 and 4). Daytime temperatures ranged between 21-30°C across most of New South Wales, with higher elevation regions ranging between 12-21°C.
Overnight temperatures were also warmer with most of the state being 1-3°C above average. Overnight temperatures ranged between 9-18°C across most of NSW, with areas in the tablelands and alpine regions recording temperatures between 0-9°C.


Normalised Difference Vegetation Index (NDVI) Anomaly
Poor agronomic conditions, relative to expectations for this time of year, continued across most of NSW during April (Figure 5). There were some improvements in areas that received higher rainfall totals in March, including the central and southern tablelands, parts of the Central West and Hunter Local Land Services regions. Plant condition in western areas of the state remains very poor and any significant change in NDVI values due to rainfall received in late April is expected to take a few weeks.

Farm Dam Water Status
Figure 6 shows the general low levels of farm dams persisting across the state to 19 April 2019. The situation remains critical across most of western NSW, and any runoff that occurred due to April rainfall won’t become apparent until the report is released next month. There has been some improvement to farm dam status in parts of the central-southern coastal hinterland and isolated areas of the Central West, Hunter and central-southern tablelands due to larger rainfall totals received in March.

Soil Water Index
An extremely low Soil Water Index (SWI, Figure 7) remains widespread across the majority of the state. There has been some improvement in the South East, and eastern areas of the Riverina, Murray and Hunter LLS regions due to rainfall received in March and April. There have also been some isolated improvements for the Western, Central Tablelands and coastal areas of the North Coast LLS regions following recent rainfall.
 to 31 March 2019")
Plant Growth Index
The Plant Growth Index (PGI; Figure 8) remains extremely low across the majority of NSW. This is reflected in the low primary production and poor agronomic conditions across the state. Areas receiving higher rainfall totals in March and April have shown improvement since the last State Seasonal Update (SSU) was released. Improvements in PGI are particularly apparent in the Central Tablelands, Greater Sydney and South East Local Land Services regions. The plant growth response for the western areas of the state that received the late and variable April rainfall will not be captured until after the release of this report.
 to 31 March February 2019")
Rainfall Index
Rainfall during March and April contributed to an improvement in the Rainfall Index (RI, Figure 9) in some areas of the state. In general, the RI remains below average to extremely low, although average levels have been recorded in the Central Tablelands, Greater Sydney, South East, Murray, Western and North Coast Local land Services regions. Despite some improvements, and as noted above for the SWI and PGI, there has been little agronomic benefit to date. Should conditions allow, any agronomic benefits from the rainfall received very late in April are likely to become evident in early May.
 to 31 March 2019")
Drought Direction Index
A large proportion of NSW is still experiencing a drier trend as of 30 April 2019. The impact of the April rainfall contributing to a wetter trend in parts of the North Coast, North West, Central West, Riverina and Western Local Land Services regions is shown in the Drought Direction Index (DDI, Figure 10).
 to 30 April 2019")
Changes in the individual drought indicators may have occurred since this update was released. For the most current information, please visit Drought Hub.
CDI status for the regions
Figure 11 displays the CDI status for each individual Local Land Services region to 30 April 2019.

Murray and Riverina regions
Despite some easing in conditions, most of the Murray and Riverina Local Land Services (LLS) regions continue to experience drought conditions. The Combined Drought Indicator (CDI) shows that the majority of the region remains in either the Drought or the Drought Affected categories (Figure 12). Recent rainfall over the past five weeks has allowed an improvement in the rainfall index (RI), however the improvements in on-ground conditions has been highly variable and remains dependant on adequate follow up rainfall. Generally, conditions to the southeast have shown greater signs of potential improvement leading to some recovery. Conditions further west remain poor with little agronomic change occurring throughout April.
The Soil Water Index (SWI) remains generally low in the west but has shown some improvement in the east. The whole region remains reliant on further rainfall to replenish soil moisture reserves.
The monthly NDVI anomaly data (Figure 13) indicates that the entire region continues to be experiencing below normal levels of greenness and has intensified since the last State Seasonal Update in March. Any significant changes in the NDVI anomaly response to the rainfall received in late April is not likely to become apparent for several weeks.


Western region
The Western Local land Services (LLS) region continues to experience drought conditions, with the entire area being in one of the three drought categories of Drought Affected, Drought or Intense Drought (Figure 15). Recent rainfall has contributed to an improvement in conditions, with some areas of the LLS region transitioning out of the Intense Drought and Drought categories and into the Drought Affected category. Follow up rainfall for these areas is required to give any confidence of long term improvement.
The monthly NDVI anomaly data (Figure 13) indicates that the entire region continues to be experiencing below normal levels of greenness. Minimal grass cover across large parts of the region continue to be of concern and any response in the areas receiving rainfall during April is not likely to become apparent for several weeks.


North West, Northern Tablelands and North Coast regions
The Combined Drought indicator (CDI; Figure 18) shows that the entire region continues to experience drought conditions and is classified in either the Drought Affected, Drought or Intense Drought categories. The area classified in Intense Drought has increased since the March State Seasonal Update (SSU) following persistent dryness and inadequate follow up rainfall being received in April.
Despite some areas of the regions receiving rainfall in March and April, the Soil Water Index (SWI) at the end of April suggests that continued and consistent rainfall is still required to replenish the long-term soil moisture deficits.
The monthly NDVI anomaly data (Figure 19) indicates that the entire region continues to be experiencing below normal levels of greenness and has intensified since the last State Seasonal Update in March. Any significant changes in NDVI values in response to rainfall received on the north coast in late April is not likely to become apparent for several weeks.


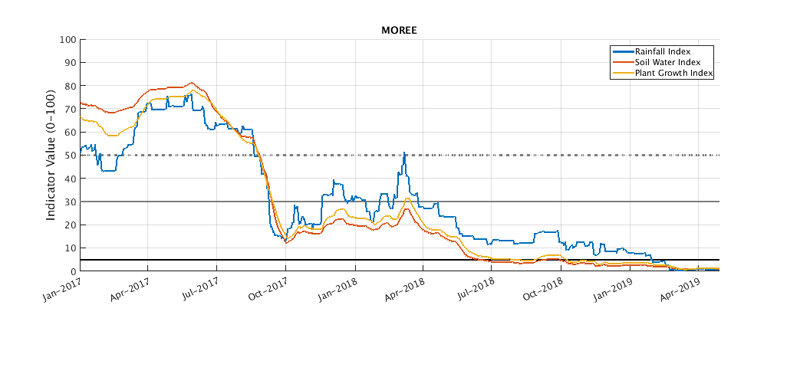
 and North West (Moree and Walgett).")
Central Tablelands, Central West, Hunter and Greater Sydney regions
Conditions across the Central Tablelands, Central West, Hunter and Greater Sydney Local Land Services regions (LLS) have remained relatively stable since the March State Seasonal Update. Areas around Condobolin, west of Coonamble and west to north-west of Gloucester remain in the Intense Drought category, while areas around Bathurst and parts of the Greater Sydney LLS region are experiencing better conditions and are currently in the Non-drought category.
Across the region, the Soil Water Index generally remains below average to extremely low at the end of April and will require a consistent rainfall pattern over coming months to amend the long term soil moisture deficits.
The monthly NDVI anomaly data (Figure 22) indicates that the majority of the region continues to be experiencing below normal levels of greenness. Dry April conditions have slowed the plant growth response to the rainfall that was received in March, with western areas yet to receive a generalised rainfall event to initiate any significant autumn plant activity. The Hunter, Greater Sydney and eastern parts of the Central Tablelands LLS regions have seen the greatest decrease in the level of greenness since the March State Seasonal Update.


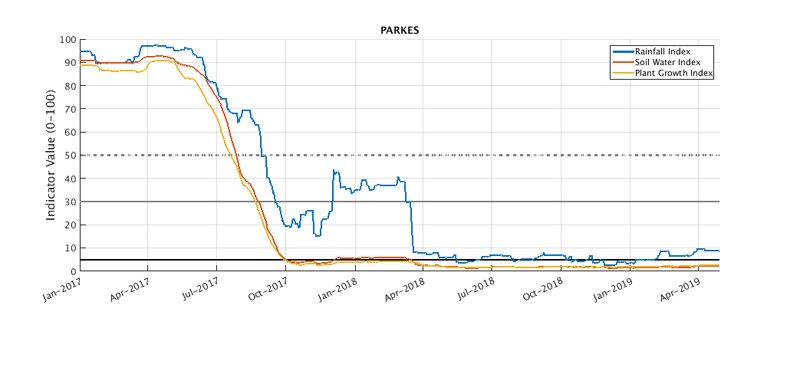
, Central West (Parkes), and Hunter (Singleton).")
South East region
Conditions across the South East Local Land Services regions (LLS) have shown some improved since the March State Seasonal Update, particularly further south in the Bega Valley where a period of short term recovery has occurred. The northern areas of the Hilltops and Upper Lachlan districts have also had a degree of improvement since late March, however dry April conditions have slowed recovery rates. The Combined Drought Indicator (Figure 21) suggests that the area in the Intense Drought category has remained in a small region around Nowra. Additional rainfall is still required for the majority of the region to provide further improvements to soil moisture stores and plant growth on a long-term basis.
The monthly NDVI anomaly data (Figure 25) indicates that the entire region continues to be experiencing below normal levels of greenness for April and has intensified since the last State Seasonal Update in March. Any significant changes in NDVI values in response to rainfall received in late April is not likely to become apparent for several weeks.


Official national outlook
The Bureau of Meteorology released the official national climate outlook for May to July on 26 April 2019. The rainfall outlook for the next three months shows no strong indication towards wetter or drier than average conditions for the majority of eastern and southern Australia. A wetter than average three months has been forecast for large parts of northwest and central Australia, however these areas typically receive little rainfall during this time of year.
The Bureau indicates that warmer than average day temperatures are likely for most of Australia, except in the southwest. Overnight temperatures are also likely to be warmer than average across Australia.
NSW outlook
For New South Wales, the rainfall outlook for May to July indicates that there is a near equal chance of wetter or drier than average conditions across most of NSW (Figure 27). The exceptions are in the southeast of the state and the region surrounding Kempsey that have an increased chance of drier than normal conditions, and part of the Western local Land Services regions which have a slightly increased chance of wetter than normal conditions.
Note that the forecasting skill levels at this time of year tend to have a moderate accuracy. This skill generally improves towards the end of May.

The BoM temperature outlook for May to July (Figures 28 & 29) indicates that there is an increased chance of warmer than average daytime and overnight temperatures across NSW.


Climate drivers
ENSO
The Bureau of Meteorology’s ENSO assessment was released on 30 April 2019. The ENSO outlook is currently at El Niño Alert, with a 70% chance of an El Niño developing in 2019. If an El Niño does develop, climate models indicate that the event is likely to be short-lived. El Niño typically brings drier than average conditions to eastern Australia in winter and spring.
Southern Oscillation Index and other indicators
The 30-day SOI value as of 28 April was negative (30 day value was -3.0, 90 day value was -7.9) but is in a range that is considered neutral (Figure 30). As the Australian monsoon season ends, the SOI will become more stable and will be a better indicator of climatic conditions.
Since early December, cloud levels near the Date Line have tended to be above average. Cloud levels towards the end of April have been below average. Equatorial cloudiness near the Date Line typically increase during an El Niño event.
Trade winds for the 5 days ending 28 April were close to average. Generally during an El Niño there is a sustained weakening of trade winds across much of the tropical Pacific, however this weakening would need to persist for an event to become established.
 to 28 April 2019")
Sea surface temperatures
Monthly sea surface temperature (SST) anomalies for April (Figure 31) were warmer than average across the tropical Pacific Ocean. The latest values for the three key NINO indices in the Tropical Pacific (for the week ending 28 April 2019) are: NINO3 +0.9°C, NINO3.4 +0.8°C and NINO4 +0.5°C. There is also anomalously warm sea surface temperatures affecting the south Pacific, extending from the south eastern Australian coastline to New Zealand.
")
Sea Sub-surface Temperatures
As of 25 April, warm anomalies persist in the top 100m of the subsurface across the equatorial Pacific. Below 150m depth, cool anomalies have strengthened over April, such that temperatures are up to three degrees cooler than average. One scenario is that cool water could propagate to the surface, reducing the length of an El Niño event if one develops. However, this also depends on the strength and pattern of trade winds and surface temperature gradients.
")
Indian Ocean
The Indian Ocean Dipole (IOD) is currently neutral and is expected to remain neutral through May. Three of six international models predict a positive IOD may form by September. A positive IOD in spring often results in below average rainfall over southern and central Australia.
How does it work?
 framework")
Much of the information in the Seasonal Conditions Report is sourced from the NSW DPI Enhanced Drought Information System (EDIS) ™. The EDIS system is currently available in prototype form and is subject to an intensive ground truthing process. For more information, visit the interactive website via Drought Hub.
EDIS is an ongoing project aimed at improving the quality and timeliness of efforts to monitor conditions across the state. Key features of the system are:
- It tracks drought by using four indicators; rainfall, soil water, plant growth, as well as tracing rainfall trends. Agronomic conditions have equal value to rainfall recorded at meteorological stations.
- The Combined Drought Indicator (CDI) brings this information together, and has been designed to characterise developing drought conditions. The key purpose for building the CDI was as a drought early warning system.
- The rainfall, soil moisture and plant growth indicators in EDIS account for conditions over a 12 month window. This provides a compromise between a highly sensitive indicator (e.g. six months) and a less sensitive indicator (e.g. 24 months).
- Climate and remote sensing data drive the information system at a high resolution, but the CDI is reported at a Parish level.
- Because of its configuration and purpose, there will be differences to the indicator used in the National Drought Monitoring Framework (the Australian Rainfall Deficiency Analyser) which relies on rainfall alone.
- The CDI has three drought categories that characterise NSW according to drought intensity as well as the main drivers of a drought event (meteorological, hydrological and agronomic). DPI considers areas Drought Affected to be experiencing a drought event.
- The Drought Affected category encompasses a wide range of conditions from the very early stages of drought entry through to a drought event becoming intense. This enables the drought monitoring system to detect a drought event early. It is also possible to stay in the Drought Affected category for some period of time.
The way in which the indicators are combined to form the CDI is described in Table 2 below.
Table 2: Description of the Combined Drought Indicator framework
CDI Phase | Technical definition | Description - typical field conditions |
|---|---|---|
Intense Drought | All three indicators (rainfall, soil water, plant growth) are below the 5th percentile | Ground cover is very low, soil moisture stores are exhausted and rainfall has been minimal over the past 6-12 months. |
Drought | At least one indicator is below the 5th percentile | Conditions may be very dry, or agronomic production is tight (low soil moisture or plant growth). It is possible to be in Drought when there has been some modest growth, or a few falls of rain. |
Drought Affected (intensifying) | At least one indicator is below the 30th percentile and the rainfall trend is negative over the past 90 days. | Conditions are deteriorating; production is beginning to get tighter. Ground cover may be modest, but growth is moderate to low for the time of year. When indicators are close to the Drought threshold drought conditions are severe. |
Drought Affected (weakening) | At least one indicator is below the 30th percentile and the rainfall trend is positive over the past 90 days. | Production conditions are getting tighter, but there have been some falls of rain over the past month. It is rare to enter the Recovering phase from the Non-Drought category; Usually there is a quick (1-2 week) transition into Drought Affected or Drought. When indicators are close to the Drought threshold drought conditions are severe. |
Recovering | All indicators are below the 50th percentile but above the 30th percentile | Production is occurring but would be considered ‘below average’. Full production recovery may not have occurred if this area has experienced drought conditions over the past six months. |
Non-drought | At least one indicator is above the 50th percentile. | Production is not limited by climatic conditions. |
The NSW State Seasonal Update is provided each month by the NSW DPI Climate Unit, which is part of the Livestock Systems Branch in DPI Agriculture.
Information used in this report was primarily sourced from the Australian Bureau of Meteorology, the US National Oceanic and Atmospheric Administration, the International Research Institute for Climate and Society (Columbia University), Geoscience Australia’s Digital Earth Australia Program, and NSW Department of Primary Industries.
Maps in this document contain data which is © Spatial Services – NSW Department of Finance, Services and Innovation (2019), Panorama Avenue, Bathurst 2795 and data which is © Commonwealth of Australia 2019, Australian Bureau of Meteorology, Melbourne. All rights reserved.
The seasonal outlooks presented in this report are obtained from the Australian Bureau of Meteorology and other sources (including World Meteorological Organisation Global Producing Centres). These outlooks are general statements about the likelihood (chance) of (for example) exceeding the median rainfall or minimum or maximum temperatures. Such probability outlooks should not be used as categorical or definitive forecasts, but should be regarded as tools to assist in risk management and decision making. Changes in seasonal outlooks may have occurred since this report was released.
All climate and remote sensing input data is supplied to the Enhanced Drought Information System™ under the Australian Creative Commons Licence (CCY 4.0) and is made available by the Terrestrial Ecosystem Research Network.
© State of New South Wales through the Department of Industry, Skills and Regional Development, 2019. You may copy, distribute and otherwise freely deal with this publication for any purpose, provided that you attribute the NSW Department of Primary Industries as the owner.
Disclaimer: The information contained in this publication is based on knowledge and understanding at the time of writing (May 2019). However, because of advances in knowledge, users are reminded of the need to ensure that information upon which they rely is up to date and to check currency of the information with the appropriate officer of the Department of Primary Industries or the user’s independent adviser.
Published by the NSW Department of Primary Industries. ISSN 2202-1795 (Online). Volume 7 Issue 4.
