

NSW State Seasonal Update - December 2019
Prepared by NSW DPI
NSW overview
NSW continued to endure widespread drought conditions during December 2019. Dry and hot conditions intensified the drought across the entire state prolonging livestock feed deficits, water shortages and low crop yields. The official climate outlook for the coming months indicates the continuation of hot conditions and a low chance of receiving rainfall that would initiate state-wide drought recovery. Farmers and communities are expected to continue drought response well into 2020.
The NSW DPI Combined Drought Indicator (CDI) shows 100% of NSW in one of the three drought categories. Intense drought conditions continued in far western and north eastern NSW, and expanded throughout central and southeast NSW during December. The CDI highlights the severity of the deficits being experienced not only for rainfall, but also the agronomic indicators that track soil water, pasture and crop growth. The conditions monitored by the CDI are consistent with on-ground reports, remote sensing of vegetation and the NSW farm dam survey.
The state received very little rainfall during December. Larger rainfall totals were received in parts of north-eastern NSW following isolated storm activity during the month. The rainfall did not improve feed growth and had little benefit to water availability. Elsewhere, the majority of NSW received less than 20% of the average rainfall for December.
The duration of the drought continues to grow. Most of NSW has been experiencing drought for greater than two years. The management of water resources and livestock feed supply remains prioritised across NSW, while there is increasing risk to intensive enterprises including the long-term health of permanent crops. Severe soil moisture deficits continue the poor summer crop outlook in the state’s north, while soil moisture levels also remain dry for the upcoming 2020 winter crop area across the state. February is the next key decision making period for producers, when the resulting summer conditions and autumn outlook can be assessed.
The current drought event is one of many factors that have influenced the 2019/20 bushfire season across NSW. The severe fire season has created further complexity to existing drought response plans and resources. There are producers and communities that have been directly impacted by both drought and fire.
The Bureau of Meteorology (BoM) Climate Outlook released on 9 January 2020 indicates that the majority of NSW has a near equal chance of receiving median rainfall for the period to April 2020. The impact of the positive Indian Ocean Dipole (IOD) and negative Southern Annular Mode (SAM) events that had a dominant influence on dry weather patterns for much of 2019 have weakened. Most climate drivers are currently neutral.
Drought Support
Producers and members of rural communities are encouraged to maintain contact with their local professionals who can facilitate access to appropriate support. If you or someone you know needs support please visit droughthub.nsw.gov.au. Alternatively, you can contact the DPI Rural Resilience Team, Rural Financial Counsellors, or your Local Land Services representatives.
Bushfire Support
Farmers are being urged to register for help to deal with significant stock losses and agricultural damage from bushfires across south eastern NSW, with the full scale of the impacts expected to take several days to emerge.
The NSW Department of Primary Industries and Local Land Services are providing assistance to fire affected landholders with emergency fodder and water, animal care, livestock or animal assessment, and where necessary euthanasia and burial.
Producers can report stock losses and infrastructure damage, or request animal assessment, or emergency fodder or water for stock, by calling the Agricultural and Animal Services Hotline on 1800 814 647. People without phone access can send a direct message via the NSW DPI Facebook page.

It is important to recognise the CDI provides an aggregated view of the State, and that on-ground conditions can be different to those displayed in the maps. They provide an ‘on average’ view of a particular region only. To report local conditions use DPI Farm Tracker.
Drought Duration
Drought duration is an important aspect of drought impact on farm businesses and communities. The drought duration map (Figure 2) shows the number of months since June 2017 that an area in NSW has been in any one of the three CDI drought categories. The drought duration map indicates that as of 31 December 2019, NSW continues to experience long-term drought conditions. There are large areas of NSW showing drought duration greater than 24 months.
*Note: The accumulated months reported are non-consecutive.

Rainfall
New South Wales (NSW) received well below average rainfall throughout December. The largest rainfall totals occurred in parts of the north-eastern coastal region. Despite isolated storm activity resulting in 50-100mm being received in these areas, the totals were still well below average. The isolated storm activity also resulted in lower totals of 10-25mm in parts of southern NSW, the northern plains and northern tablelands. Elsewhere the majority of the state received less than 10mm of rain during December.

Temperature
The average December daytime temperatures (Figure 4) were above 30°C across most of inland NSW, with temperatures up to 42°C in the Western Local Land Services region. Coastal areas experienced temperatures between 18-33°C. Analysis from the Bureau of Meteorology indicates that numerous locations experienced the highest daily temperatures on record for the month.
Overnight temperatures (Figure 5) were above 12°C across NSW, except in alpine and tableland regions where temperatures ranged between 6-15°C. Bureau of Meteorology data indicates that overnight temperatures were above average to the highest on record for the majority of NSW.


Normalised Difference Vegetation Index (NDVI) Anomaly
The Normalised Difference Vegetation Index (NDVI) anomaly (Figure 6) shows that plant greenness levels continue to remain well below the long term levels expected during December 2019 across most of NSW. The NDVI is an index that provides a measure of vegetation density and condition. The anomaly map shows the deviation of the current NDVI from the long-term average for this time of year.
Note, The Bureau of Meteorology (BoM) issued a Service Caution Notice late in 2019 as follows: From March 2019, and possibly earlier, NDVI data have shown lower values in southern Australia due to a drift in the source NOAA satellite. The issue is being investigated and we expect corrections to be made in the coming two months. In the interim, please note the data may have a low (brown) bias and should be used with caution.

Farm Dam Water Status
The available satellite data indicates that farm dam levels remain low across the majority of NSW (Figure 7). The low levels of dam recharge across much of the state are a result of low rainfall and high evaporative rates over recent months. Water availability and management remains a priority across the state as summer continues. The increased water detected around Bourke in November's farm dam monitoring has now declined, due to very high evaporation over December 2019.
DPI and Geoscience Australia monitor 67,000 farm dams each month using the Landsat satellite and report average information for each parish.

Significant Events
High December Temperatures
NSW experienced very high daytime temperatures during December. The maximum temperature deciles were the highest on record for the majority of the state, with the remainder of the state recording very much above average temperatures. The NSW coast received temperatures that were 2 - 3°C above the December average, while the remainder of the state experienced daytime temperature anomalies that were 3 - 6°C above the average. There were numerous locations that broke the existing highest daily maximum for December and in some instances this occurred on multiple days.
Overnight temperatures were also warmer than average for most of NSW, however the magnitude above the December average was less than what was observed for the daytime temperatures.
Heightened Dust Activity
Dust activity has been increasing in recent months as outlined in the NSW Environment Energy and Science (EES) DustWatch reports. On-ground reporting indicates the prevalence of dust activity occurring throughout the month. Large areas of low ground cover due to the extended periods of dryness are likely to continue the risk of increased dust activity for at least the short-term.
As the risk of dust activity increases, it is recommended to remain vigilant to possible health risks associated with dust exposure. The NSW Department of Health has provided a brief overview of health effects and precautions relating to dust exposure.
Further information and subscription services relating to the NSW EES Dustwatch report. The November edition the DustWatch report is scheduled to be available in the second half of December
Soil Water Index
The Soil Water Index (Figure 8, SWI) remains below average to extremely low across the majority of NSW. Continued widespread dryness throughout December contributed to the drying of soil moisture since November. On-ground reports across NSW continue to emphasise issues relating to low soil moisture levels.
 to 31 December 2019")
Plant Growth Index
There was little improvement to the Plant Growth Indicator (Figure 9, PGI) during December, highlighting the continuation of dry conditions. The majority of NSW is experiencing below average to extremely low plant growth relative to the long term data.
 to 31 December 2019")
Rainfall Index
The Rainfall Index (Figure 10, RI) shows the majority of the state remaining below average to extremely low due to the persistent dryness continuing during December. The Rainfall Index transitioned into the extremely low category for large areas of southern NSW since the November State Seasonal Update report.
 to 31 December 2019")
Drought Direction Index
The majority of NSW experienced a drying trend during December as indicated by the Drought Direction Index (Figure 11, DDI). This confirms the continuation of widespread dryness at the start of 2020 in addition to a dry 2019. The blue areas on the map represent areas receiving higher rainfall totals during the month. Despite this there has been no initiation of drought recovery in these areas.
 to 31 December 2019")
Changes in the individual drought indicators may have occurred since this update was released. For the most current information, please visit DroughtHub.
CDI status for the regions
Figure 12 displays the CDI status for each individual Local Land Services region to 31 December 2019.

Murray and Riverina regions
The Murray and Riverina Local Land Services (LLS) regions continue to experience widespread drought conditions. The Combined Drought Indicator (CDI, Figure 13) shows that the region is in one of the three drought categories. Conditions have intensified across the region since the November State Seasonal Update, including areas around Young, Cootamundra, Gundagai, Urana and to the east of Balranald.
The monthly NDVI anomaly data (Figure 14) shows that the LLS regions continue to experience below normal levels of greenness. Extended periods of below average and ineffective rainfall has caused poor agronomic activity in the region.
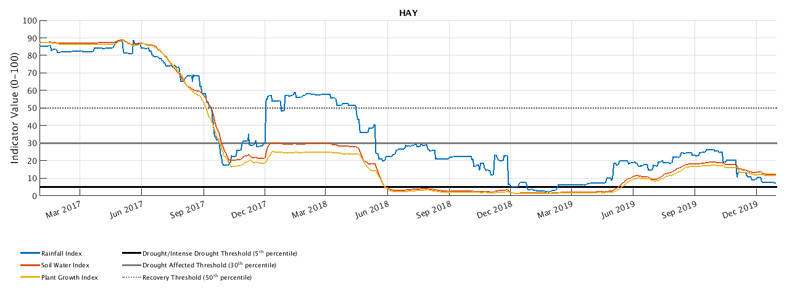
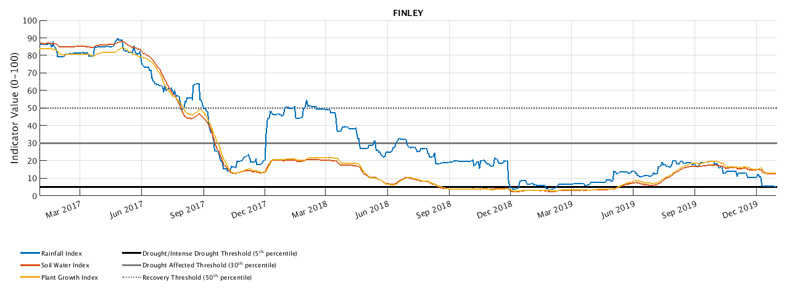
The time series charts (Figure 15) shows the individual response of the drought indices for Hay, Finley and Temora. The charts show that there were some beneficial periods of rainfall since May, however this has not improved conditions. The drought indices at the end of December reflect the poor entry into summer resulting in diminishing 2019 crop yields and pasture growth in much of the region.


Western region
The Western Local Land Services (LLS) region continues to experience widespread drought conditions. The Combined Drought Indicator (CDI, Figure 16) shows that the whole region is in one of the three drought categories. The CDI shows that conditions are intensifying in the central and northern areas that received higher rainfall totals in early November, after it was acknowledged in the November State Seasonal Update that his rainfall had been ineffective for pasture growth. Further analysis of high resolution satellite imagery for December confirms the lack of pasture growth.
The monthly NDVI anomaly data (Figure 17) shows below normal levels of greenness compared to the long term expectations. This has been driven by poor agronomic activity due to insufficient and ineffective rainfall during winter and spring. It is important to recognise that producers in the west and far west are managing the combined effect of total grazing pressure and dry meteorological conditions.
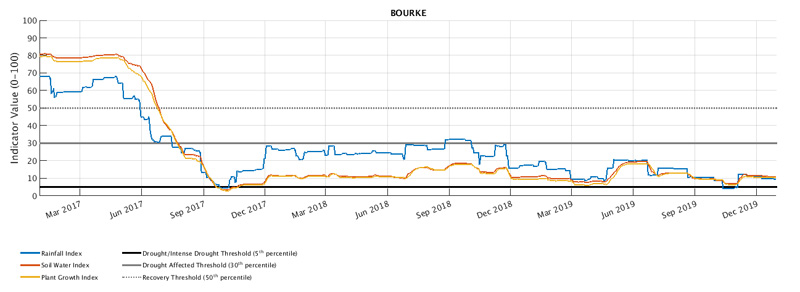
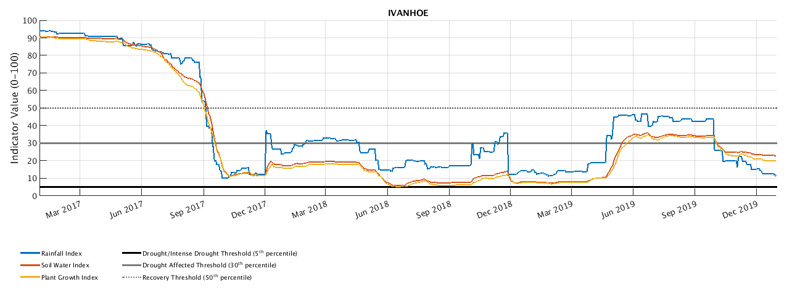
The time series charts (Figure 18) show the individual response of the drought indices for Bourke, Ivanhoe, and Wentworth. All locations show the continuation of poor conditions and a false recovery occurring at Ivanhoe from rainfall received in April and May. The rainfall received at Bourke and Wentworth was ineffective. This is highlighted by the soil moisture and plant growth indices failing to show any substantial response. There has been little if any relief to drought conditions for a long period of time.


North West, Northern Tablelands and North Coast regions
Drought continues to impact the entire North West, Northern Tablelands and North Coast Local Land Services (LLS) regions (Figure 19). Field reports continue to confirm the severity of drought conditions being experienced across the region.
The monthly NDVI anomaly data (Figure 20) shows that the region is experiencing below normal levels of greenness compared to long term expectations. This reflects the insufficient rainfall over several months resulting in poor long-term agronomic activity.
The time series charts (Figure 21) showing the individual response of the drought indices for Moree, Walgett and Tenterfield reflect the long term trend of the drought indices tracking in the bottom 5th percentile of the historic range. All three locations show extremely low rainfall indices for the majority of 2019 and highlights the ongoing intensity and duration of drought conditions occurring in northern NSW. For example there was a small positive rainfall shift at Tenterfield in early 2019, however this rainfall was ineffective as shown by the lack of response in the soil moisture and plant growth indices.


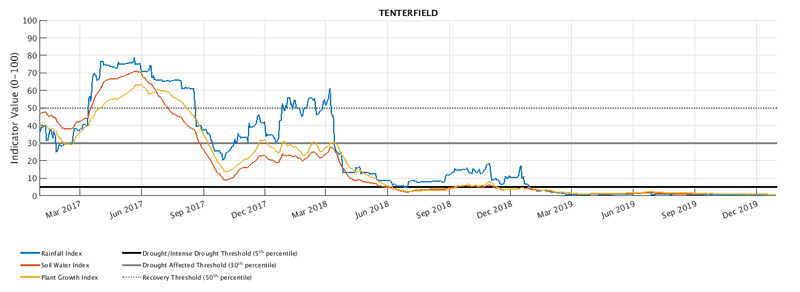
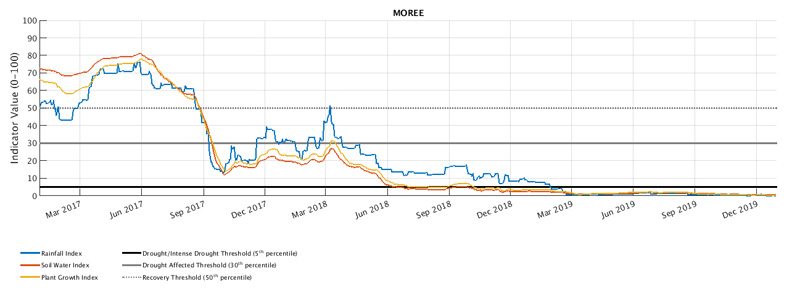
 and North West (Moree and Walgett).")
Central Tablelands, Central West, Hunter and Greater Sydney regions
The Central Tablelands, Central West, Hunter and Greater Sydney Local Land Services regions (LLS) continue to experience drought conditions. The entire region experienced the intensification of conditions during December with the Combined Drought Indicator (CDI) showing a large transition from the Drought to Intense Drought category (Figure 22).
The monthly NDVI anomaly data (Figure 23) shows the continuation of below normal levels of greenness compared to long term expectations. This has been driven by insufficient rainfall and poor agronomic activity over an extended period of time.
The time series charts (Figure 24) show the individual response of the drought indices for Cowra, Condobolin and Singleton. Drought conditions have impacted the region for an extended period of time. The soil moisture and plant growth indices have struggled to surpass the lowest 10th percentile of the long-term data. The charts show variations in the rainfall index between locations. Despite this, all sites show that rainfall deficits have been large and that the rainfall received has been ineffective.


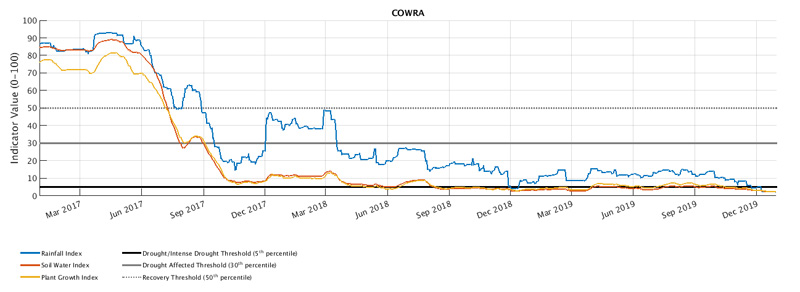
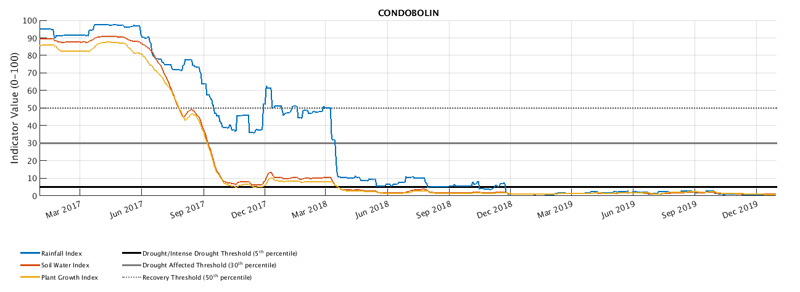
, Central West (Condobolin), and Hunter (Singleton).")
South East region
The South East Local Land Services (LLS) region continue to experience widespread drought conditions. The Combined Drought Indicator (CDI, Figure 25) shows that the whole region is in one of the three drought categories. Conditions have intensified since the November State Seasonal Update, showing a large transition from the Drought to Intense Drought category. On-ground reports indicate that the region continues to manage very difficult circumstances during summer.
The monthly NDVI anomaly data (Figure 26) indicates widespread below normal levels of greenness compared to the long term expectations. This has been driven by poor agronomic activity over the past few months and insufficient rain to encourage sustained agronomic activity.
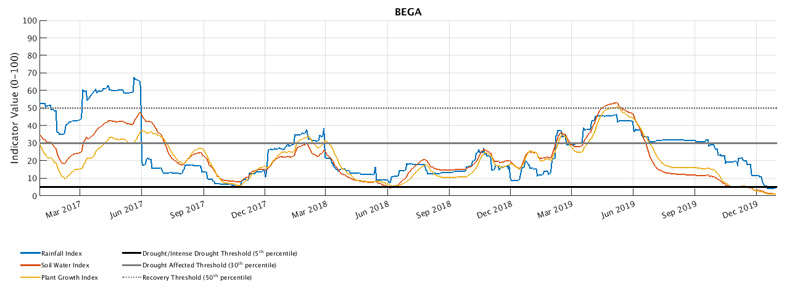
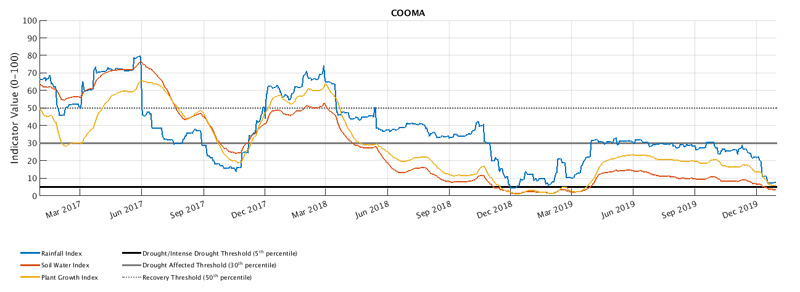
The time series charts (Figure 27) show the individual response of the drought indices at Bega, Goulburn and Cooma. Bega shows an example of a false recovery where there was a short period of recovery between March and June. This rapidly fell below drought thresholds in July. This highlights the need for sustained follow up rainfall to initiate long-term drought recovery


Official national outlook
The official National Climate Outlook was released by the Bureau of Meteorology (BoM) on 9 January 2020. February to April has roughly equal chances of being wetter or drier than average for most of Australia. A pocket of southeast Queensland and northeast NSW is slightly more likely to be drier than average, while parts of the far north are more likely to be slightly wetter than average. The Bureau notes that the positive Indian Ocean Dipole (IOD) and the negative Southern Annular Mode (SAM) phase has ended. Most of Australia's climate influences are now neutral. While outlooks for drier than average conditions have eased compared to those issued in late 2019, several months of above average rainfall are needed to see a recovery from current long-term rainfall deficiencies.
Daytime temperatures for February to April are likely to be warmer than average over Australia. Warmer nights are also likely for the majority of Australia during February to April.
NSW outlook
The majority of NSW is forecast to have a near equal chance of receiving wetter or drier than average conditions during February to April (Figure 28). The northern coastal region has a slightly lower chance of receiving median rainfall during the period.
The historical rainfall outlook accuracy for the forecast period is moderate to high for most of NSW.

The BoM temperature outlook for February to April (Figures 29 & 30) indicates higher chances of warmer than average daytime and overnight temperatures for all of NSW, particularly in the north eastern and coastal areas of the state.


Climate drivers
El Niño–Southern Oscillation (ENSO)
The Bureau of Meteorology’s (BoM) El Niño–Southern Oscillation (ENSO) Outlook was released on 7 January 2020. The outlook remains neutral, however the tropical ocean near and to the west of the International Date Line is warmer than average, this could draw some moisture away from Australia.
The tropical Pacific Ocean sea surface temperatures are slightly warmer than average and atmospheric indicators are generally neutral. Trade winds have been close to average over the past week (to 5 January 2020). On average trade winds have been average over the past 6 months, with exceptions in the far west tropical Pacific where there have been slightly weaker.
Most climate models forecast ENSO-neutral conditions until the end of autumn. When ENSO is neutral, it has little effect on Australian and global climate, meaning other influences are more likely to dominate.
Southern Oscillation Index
The average Southern Oscillation Index (SOI) for the 30 days ending 5 January 2020 was -5.7. The 90 day value was -5.7. Sustained negative values of the SOI below −7 typically indicate El Niño while sustained positive values above +7 typically indicate La Niña. Values between +7 and −7 generally indicate neutral conditions.
 to 5 January 2020")
Sea surface temperatures
Monthly sea surface temperatures for December were about average across much of the western equatorial Pacific Ocean (Figure 32). A thin band of warmer than average water was also present along the equator in the eastern Pacific. Temperatures were also warmer than normal around much of north, west and south Australia during December.
The December values of the three key NINO indices in the tropical Pacific were: NINO3 +0.4°C, NINO3.4 +0.4°C and NINO4 +0.8°C. Persistent NINO3 or NINO3.4 values warmer than +0.8 °C are typical of El Niño, while persistent values cooler than −0.8 °C typically indicate La Niña.
")
Sea sub-surface temperatures
The four-month sequence of equatorial sub-surface temperature anomalies (to December 2019) shows cool anomalies in the eastern equatorial Pacific, at a depth of around 50-200m. Warm anomalies extend across the top 150m of the western to the central equatorial Pacific. The pattern has remained similar over the past few months, though the area of cool anomalies below the surface has shifted eastwards.
")
Indian Ocean
The strong positive Indian Ocean Dipole (IOD) event affecting Australian weather patterns for much of 2019 has returned to neutral. The event was one of the strongest to impact Australia in recent history. The IOD is expected to remain neutral over the coming months, meaning it will have little influence on Australian and global climate. The latest weekly value to 5 January 2020 was +0.2 °C.
Southern Ocean
The strong negative Southern Annular Mode (SAM) index that persisted from October through December 2019 finally broke down in late December. The current index is neutral, but is expected to become slightly negative in the next week before returning to neutral conditions in the following week.
How does it work?
Much of the information in the Seasonal Conditions Report is sourced from the NSW DPI Enhanced Drought Information System (EDIS)™. The EDIS system is currently available in prototype form and is subject to an intensive ground truthing process. For more information, visit the interactive website via DroughtHub.
EDIS is an ongoing project aimed at improving the quality and timeliness of efforts to monitor conditions across the state. Key features of the system are:
- It tracks drought by using four indicators; rainfall, soil water, plant growth, as well as tracing rainfall trends. Agronomic conditions have equal value to rainfall recorded at meteorological stations.
- The Combined Drought Indicator (CDI) brings this information together, and has been designed to characterise developing drought conditions. The key purpose for building the CDI was as a drought early warning system.
- The rainfall, soil moisture and plant growth indicators in EDIS account for conditions over a 12 month window. This provides a compromise between a highly sensitive indicator (e.g. six months) and a less sensitive indicator (e.g. 24 months).
- Climate and remote sensing data drive the information system at a high resolution, but the CDI is reported at a Parish level.
- Because of its configuration and purpose, there will be differences to the indicator used in the National Drought Monitoring Framework (the Australian Rainfall Deficiency Analyser) which relies on rainfall alone.
- The CDI has three drought categories that characterise NSW according to drought intensity as well as the main drivers of a drought event (meteorological, hydrological and agronomic). DPI considers areas Drought Affected to be experiencing a drought event.
- The Drought Affected category encompasses a wide range of conditions from the very early stages of drought entry through to a drought event becoming intense. This enables the drought monitoring system to detect a drought event early. It is also possible to stay in the Drought Affected category for some period of time.
The way in which the indicators are combined to form the CDI is described in Table 1 below.
Table 1: The way in which the indicators are combined to form the CDI is described
CDI Phase | Technical definition | Description - typical field conditions |
|---|---|---|
Intense Drought | All three indicators (rainfall, soil water, plant growth) are below the 5th percentile | Ground cover is very low, soil moisture stores are exhausted and rainfall has been minimal over the past 6-12 months. |
Drought | At least one indicator is below the 5th percentile | Conditions may be very dry, or agronomic production is tight (low soil moisture or plant growth). It is possible to be in Drought when there has been some modest growth, or a few falls of rain. |
Drought Affected (intensifying) | At least one indicator is below the 30th percentile and the rainfall trend is negative over the past 90 days. | Conditions are deteriorating; production is beginning to get tighter. Ground cover may be modest, but growth is moderate to low for the time of year. When indicators are close to the Drought threshold drought conditions are severe. |
Drought Affected (weakening) | At least one indicator is below the 30th percentile and the rainfall trend is positive over the past 90 days. | Production conditions are getting tighter, but there have been some falls of rain over the past month. It is rare to enter the Recovering phase from the Non-Drought category; Usually there is a quick (1-2 week) transition into Drought Affected or Drought. When indicators are close to the Drought threshold drought conditions are severe. |
Recovering | All indicators are below the 50th percentile but above the 30th percentile | Production is occurring but would be considered ‘below average’. Full production recovery may not have occurred if this area has experienced drought conditions over the past six months. |
Non-drought | At least one indicator is above the 50th percentile. | Production is not limited by climatic conditions. |
The NSW State Seasonal Update is provided each month by the NSW DPI Climate Unit, which is part of the Livestock Systems Branch in DPI Agriculture.
Information used in this report was primarily sourced from the Australian Bureau of Meteorology, the US National Oceanic and Atmospheric Administration, the International Research Institute for Climate and Society (Columbia University), Geoscience Australia’s Digital Earth Australia Program, and NSW Department of Primary Industries.
Maps in this document contain data which is © Spatial Services – NSW Department of Finance, Services and Innovation (2020), Panorama Avenue, Bathurst 2795 and data which is © Commonwealth of Australia 2020, Australian Bureau of Meteorology, Melbourne. All rights reserved.
The seasonal outlooks presented in this report are obtained from the Australian Bureau of Meteorology and other sources (including World Meteorological Organisation Global Producing Centres). These outlooks are general statements about the likelihood (chance) of (for example) exceeding the median rainfall or minimum or maximum temperatures. Such probability outlooks should not be used as categorical or definitive forecasts, but should be regarded as tools to assist in risk management and decision making. Changes in seasonal outlooks may have occurred since this report was released.
All climate and remote sensing input data is supplied to the Enhanced Drought Information System ™ under the Australian Creative Commons Licence (CCY 4.0) and is made available by the Terrestrial Ecosystem Research Network
© State of New South Wales through the Department of Industry, Skills and Regional Development, 2020. You may copy, distribute and otherwise freely deal with this publication for any purpose, provided that you attribute the NSW Department of Primary Industries as the owner.
Disclaimer: The information contained in this publication is based on knowledge and understanding at the time of writing (January 2020). However, because of advances in knowledge, users are reminded of the need to ensure that information upon which they rely is up to date and to check currency of the information with the appropriate officer of the Department of Primary Industries or the user’s independent adviser.
Published by the NSW Department of Primary Industries. ISSN 2202-1795 (Online). Volume 7 Issue 12.
