

NSW State Seasonal Update - February 2020
Prepared by NSW DPI
NSW overview
High rainfall during the first two weeks of February 2020 weakened drought conditions across much of eastern NSW. The drought event is currently being further weakened by a state-wide rain bearing system, providing follow-up to the rainfall received in February. There is also potential for high rain totals to occur over some of the drier areas in western NSW over the coming days.
Despite the rainfall weakening the drought event, it is not over and a ‘watch and monitor’ status remains in place. Several weeks of growth and follow-up rainfall are required to continue any recovery from drought. Drought conditions intensified in the west of NSW during February.
The NSW DPI Combined Drought Indicator (CDI) shows 98.5% of NSW remains in one of the three drought categories at the end of February. The proportion of the state in the Intense Drought category fell across the state during the month and the Drought Direction Index is tracking improving conditions in eastern NSW.
High rainfall was received in parts of north eastern, central and coastal NSW during February. This has triggered a positive fodder crop and pasture growth response in these areas. Much of coastal NSW, the Sydney basin and some slopes districts are likely to experience high pasture growth during autumn. This should provide an improved feed base by the start of winter.
The February rain distribution and soil moisture retention was variable across tableland regions. February rainfall was also variable in central NSW, while conditions were drier in western and southern NSW. Extensive areas continue to experience drought conditions and rainfall has been ineffective for improving livestock feed and crop potential.
Soil moisture levels and confidence in the northern crop belt improved during the month, however more rain is required to ensure a 2020 winter crop. The southern grains region remains under pressure with drier soil profiles as key planting periods approach. Good falls are currently being recorded across the southern and northern zones.
The Bureau of Meteorology (BoM) Climate Outlook released on 5 March 2020 indicates that the majority of NSW has a slightly wetter to near equal chance of receiving wetter than median rainfall in the April to June 2020 period The main global climate drivers are currently neutral meaning that the rainfall is likely to continue to be driven by short-term synoptic weather patterns.
Drought Support
Producers and members of rural communities are encouraged to maintain contact with their local professionals who can facilitate access to appropriate support. If you or someone you know needs support, please visit DroughtHub. Alternatively, you can contact the DPI Rural Resilience Team, Rural Financial Counsellors, or your Local Land Services representatives

It is important to recognise the CDI provides an aggregated view of the State, and that on-ground conditions can be different to those displayed in the maps. They provide an ‘on average’ view of a particular region only. To report local conditions, use DPI Farm Tracker.
Drought Duration
Drought duration is an important component of drought impact on farm businesses and communities. The drought duration map (Figure 2) shows the number of months since June 2017 that an area in NSW has been in one of the three CDI drought categories. The map indicates that as of 29 February 2020, NSW continues to experience long-term drought conditions. The majority of NSW has experienced drought conditions for longer than 24 months.
*Note: The accumulated months reported are non-consecutive.

Rainfall
The highest rainfall totals were received in eastern New South Wales (NSW) during February (Figure 3a). The North Coast, Sydney region and parts of the South Coast received the largest totals ranging between 250-800mm for the month. Parts of the North West and Northern Tablelands Local Land Services (LLS) regions also received higher totals of 100-200mm, however the distribution was more isolated. Elsewhere, higher rainfall totals were sparse, while large areas in central and western NSW received totals of less than 25mm and the far west received less than 10mm during the month.
Despite variable rain distribution, rainfall totals for the 2020 calendar year have been average to very much above average for much of NSW. Rainfall totals in eastern NSW (Figure 3b) have the potential to initiate drought recovery. There is further potential occurring now in the first week of March, with the current widespread rain event providing further improvement to conditions and assisting a promising start to autumn across much of the state. Rainfall totals for the week are shown in Figure 3c. Further rainfall is expected as the system moves east.


Temperature
The average February daytime temperatures (Figure 4) were above 30°C across most of NSW, with temperatures up to 36°C in the north west. Coastal and slopes areas experienced temperatures between 21-30°C.
Overnight temperatures (Figure 5) were above 12°C across most of NSW. Overnight temperatures were higher in most of the western and northern NSW, while alpine areas experience lower temperatures.
Bureau of Meteorology data indicates that daytime temperatures were average to highest on record and overnight temperatures were above average to very much above average for the majority of NSW.


Normalised Difference Vegetation Index (NDVI) Anomaly
The Normalised Difference Vegetation Index (NDVI) anomaly (Figure 6) shows that plant greenness levels for February 2020 remain below the expected long-term levels across most of NSW. The widespread negative anomalies across coastal regions and the adjacent ranges are the result of the severe bushfire impact occurring over the last several months. Continued rainfall is needed in the coming months to restore vegetation activity to long-term expectations and this is expected to take time. Elsewhere there has been a slight improvement in the NDVI anomaly this month. This has been in response to rainfall received in February.
The NDVI is an index that provides a measure of vegetation density and condition. The anomaly map shows the deviation of the current NDVI from the long-term average for this time of year.
Note, The Bureau of Meteorology (BoM) issued a Service Caution Notice late in 2019 as follows: From March 2019, and possibly earlier, NDVI data have shown lower values in southern Australia due to a drift in the source NOAA satellite. The issue is being investigated and we expect corrections to be made in the coming two months. In the interim, please note the data may have a low (brown) bias and should be used with caution.

Significant Events
Significant February and March Rainfall
Favourable synoptic patterns resulted in above average rainfall across most of the eastern half of the State. The coast and adjacent ranges were especially wet during the month. The Bureau of Meteorology reported that most of the region experienced very much above average rainfall, with many locations recording their highest February daily and monthly totals in history. Rainfall for February was 104% above the long-term average, making it the State's wettest February since 2012 and its wettest month since September 2016. Despite this, large areas still received low rainfall totals for the month, particularly in western NSW, where rainfall was below average to very much below average.
Maps of the short-term soil moisture (Figure 7a) and pasture (Figure 7b) response to February rainfall shows that the east of the state experienced improved conditions over the month. There is significant variation within regions, particularly in the transition zones from east to west. On the ground this appears as areas of greening pasture with some growth of biomass over the last fortnight of February. Without follow up rainfall these responses will be temporary. Detailed assessments available through FarmTracker highlight that while the response has been positive, pastures generally lack the bulk at this stage to support a change from drought grazing tactics.
A rain bearing system emanating from ex-tropical cyclone Esther formed in the Northern Gulf and drifted south across NSW on 3 March 2020. This has bought significant rainfall across a wide area of NSW and the event is expected to bring more rainfall in the days following the release of this issue of the State Seasonal Update (SSU). Week to date rainfall up until 9am on March 5 (Figure 3c) provides an interim assessment of the rainfall event, but the situation is evolving. The full implication of the event on the drought will be available in the March 2020 SSU


Heightened Dust Activity
Despite rainfall during February, there is still high risk of increased dust activity in much of western and southern NSW. Large areas of low ground cover persist and are likely to continue the risk of increased dust activity for at least the short-term.
The NSW Environment Energy and Science (EES) DustWatch provides a dust monitoring service. The January edition of the DustWatch report is scheduled to be available in the second half of February.
Soil Water Index
The Soil Water Index (Figure 8, SWI) remains below average to extremely low across the majority of NSW. Despite higher rainfall totals received in eastern NSW in February, there has yet to be wide scale improvements in the SWI. While the index suggests slightly better soil moisture conditions in parts of the Western Local Land Services region, the Plant Growth Indicator, on-ground reports and available satellite imagery continue to indicate that soil moisture has been largely ineffective for providing relief to enduring drought conditions.
 to 29 February 2020")
Plant Growth Index
The Plant Growth Indicator (Figure 9, PGI) continues to show below average to extremely low plant growth. Despite some areas receiving higher rainfall totals during the month, the PGI suggests there is a need for further follow-up rainfall to rectify long-term deficits and continue a sustained opportunity for further plant growth. Despite parts of western NSW having a slightly improved PGI Index compared to other areas of the state, the index suggests that the difference is not enough to influence the extent of the long-term duration of unfavourable growing conditions and total grazing pressure experienced in the region. The available satellite imagery supports this by showing low levels of plant health (greenness) relative to expectations for February.
 to 29 February 2020")
Rainfall Index
Despite high rainfall occurring in parts of the state during February, the Rainfall Index (Figure 10, RI) shows most of the state remaining below average to extremely low. This suggests that rainfall deficits have been severe over the last twelve months and that consistent rainfall is required to correct these deficits. The higher rainfall totals occurring on the north coast and Sydney region have been enough to return the RI to average levels, outlining the significance of this rainfall during the month.
 to 29 February 2020")
Drought Direction Index
The Drought Direction Index (Figure 11, DDI) indicates the areas receiving higher rainfall totals during the month. The weakening drought conditions occurred primarily in central and eastern NSW, providing an opportunity for further rainfall to be more effective if it occurs in the next month. Elsewhere, the continuation of the drying trend continued.
 to 29 February 2020")
Changes in the individual drought indicators may have occurred since this update was released. For the most current information, please visit DroughtHub.
CDI status for the regions
Figure 12 displays the CDI status for each individual Local Land Services region to 29 February 2020. The regional descriptions are based on data available till the end of February 2020 and do not include the significant rainfall event occurring across NSW at the time of compiling this month State Seasonal Update.

Murray and Riverina regions
Despite isolated rain in February, the Murray and Riverina Local Land Services (LLS) regions continue to experience widespread drought conditions. The Combined Drought Indicator (CDI) shows most of the region being in one the CDI drought categories (Figure 13). The rain has caused some of the region to transition out of the more intense CDI categories since January, however the soil moisture and plant growth indicators have shown little response in many areas. There has been more relief experienced in parts of the alpine areas in the east of the region. Further rainfall is required in the short-term to provide a sustained improvement to field conditions prior to the winter feed gap.
The monthly NDVI anomaly data (Figure 14) shows that the LLS regions continue to experience below normal levels of greenness, particularly to the south and east of Tumut. The effects from the severe bushfire season is impacting the anomaly in some of these areas. Elsewhere dryness has constrained plant growth for several months.
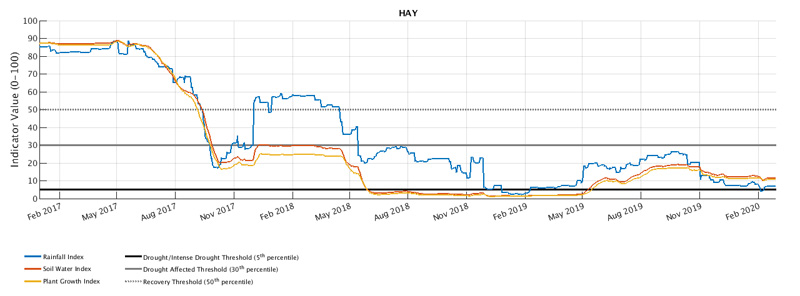
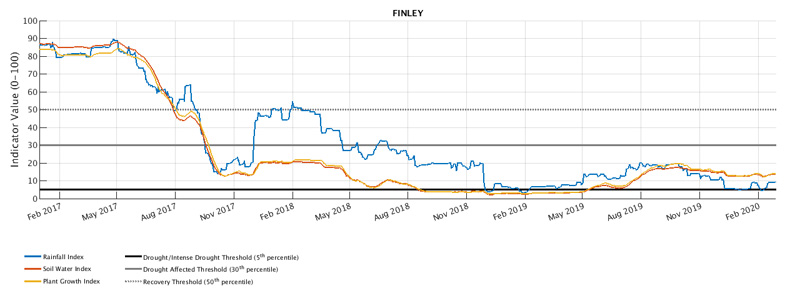
The time series charts (Figure 15) shows the individual response of the drought indices for Hay, Finley and Temora. The figures show that despite isolated rain in February, there are still widespread areas that had low rainfall and continue to endure poor conditions.


Western region
The Western Local Land Services (LLS) region continues to experience widespread drought conditions. Despite isolated rain in parts of the region during February, the Combined Drought Indicator (CDI, Figure 16) shows that the whole region is in one of the three drought categories. Field reports confirm the isolated nature of the rain and that many areas had little or no rain during the month. The CDI shows improvement in the east, where the area in Intense Drought has reduced since the January State Seasonal Update. A consistent follow-up rainfall pattern remains critical for a sustained improvement in these areas, with much of the region requiring an effective rainfall event to initiate prospects of any drought recovery.
The monthly NDVI anomaly data (Figure 17) shows below normal levels of greenness compared to the long-term expectations. This has been driven by long-term dryness and ineffective rainfall constraining plant growth. In addition to enduring dryness, producers in the west and far west are also managing the effect of total grazing pressure and hot conditions.
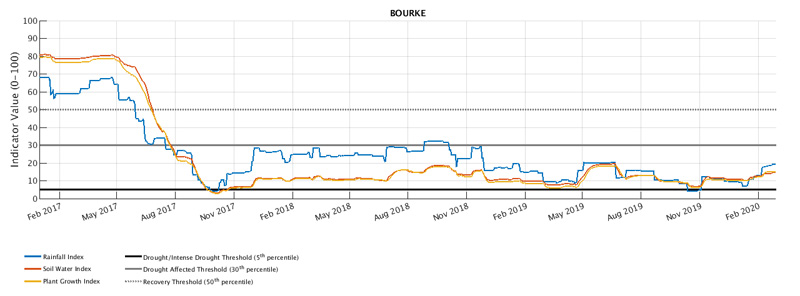
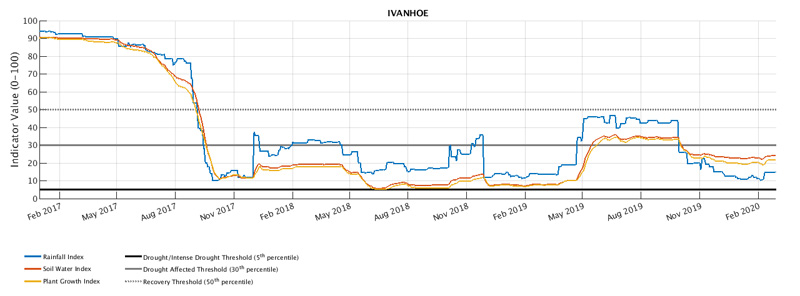
The time series charts (Figure 18) show the individual response of the drought indices for Bourke, Ivanhoe, and Wentworth. All locations show an extended period of poor conditions. There is an example of a false early-stage recovery at Ivanhoe in April and May 2019. This shows that follow-up rainfall is critical for sustaining longer-term drought recovery. The rain received at Bourke and Wentworth has been ineffective over the last two years, as shown by the soil moisture and plant growth indices failing to show any substantial response to rainfall.


North West, Northern Tablelands and North Coast regions
There was a reduction in the area categorised in the Intense Drought category in the North West, Northern Tablelands and North Coast Local Land Services (LLS) regions during February. The recent rain is the primary reason for the reduction. Despite rain, the LLS regions are still categorised in one of the three Combined Drought Indicators (CDI) drought categories. The CDI shows that the soil moisture and plant growth indicators are responding to the rain though further rain is needed. Parts of the North Coast experienced very high rain totals in February and have transitioned into the Non-drought category. Follow-up rain will increase the chances of a sustained longer-term recovery.
The monthly NDVI anomaly data (Figure 20) shows that the region is experiencing below normal levels of greenness compared to long term expectations. This reflects insufficient rainfall over several months resulting in a long period of poor agronomic activity. The impact of the severe bushfire season is also contributing to the NDVI anomalies at present.
The time series charts (Figure 21) showing the individual response of the drought indices for Moree, Walgett and Tenterfield reflect the long-term trend of the drought indices tracking in the bottom 5th percentile of the historic range. Despite the recent rain, the improvement to the rainfall index is modest, indicating that more rain is needed to correct long-term deficits. Further time is also needed to assess the longer-term response of the soil water and plant growth indicators following rainfall.
The time series chart for Moonee Beach near Coffs Harbour has been included in this month's update to illustrate the indices in a region that has recently transitioned out of drought into the Non-Drought category. Very high rainfall in early February has led to a rapid increase in the Rainfall Index, and it is now sitting above the 50th Percentile (Median). The Soil Water and Pasture Growth Indexes are also increasing although lag the Rainfall Index. Comparing the time series, the drought event has been shorter and less intense than the other locations Walgett, Moree and Tenterfield. This leads to a faster recovery from drought in the Coffs Harbor region compared to the other locations.


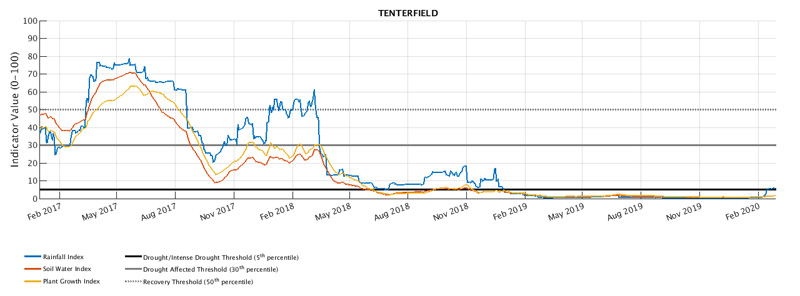
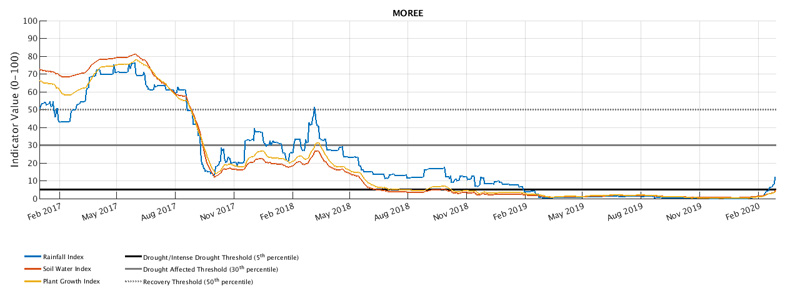
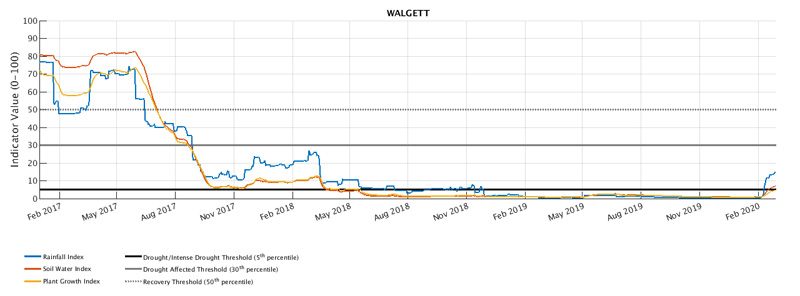
, North West (Moree & Walgett) and North Coast (Moonee Beach).")
Central Tablelands, Central West, Hunter and Greater Sydney regions
The Central Tablelands, Central West, Hunter and Greater Sydney Local Land Services (LLS) regions experienced a reduction in the area categorised as Intense Drought during February. This is due to the rainfall received over parts of the region during the last two months. Despite this, the Central West, Hunter and Central Tablelands LLS regions are still categorised as being in one of the three Combined Drought Indicator (CDI, Figure 22) drought categories. This reflects the extent of on-going drought conditions being experienced and that the soil moisture and plant growth indicators are slow or need more rain to respond. The Greater Sydney LLS has had additional improvements due to high rainfall totals in February and most of the region is now in the Non-drought category.
The monthly NDVI anomaly data (Figure 23) shows the continuation of below normal levels of greenness compared to long term expectations. The impact of the severe bushfire season is also contributing to the NDVI anomalies at present. Despite this, there has been improvements in the levels of greenness for some parts (e.g. Coonamble, Dubbo, Merriwa, Singleton and Forbes regions). Follow-up rainfall will assist further improvements in plant growth as the winter feed gap approaches for much of the region.
The time series charts (Figure 24) show the individual response of the drought indices for Cowra, Condobolin and Singleton. Drought conditions have impacted the region for an extended period, where the soil moisture and plant growth indices have struggled to surpass the lowest 10th percentile of the long-term data. Despite the recent rain, there was little improvement to the indicators at these locations in February. Singleton shows the greatest improvement in the Rainfall Index, however more time is needed to assess the long-term response to the soil water and plant growth indicators.


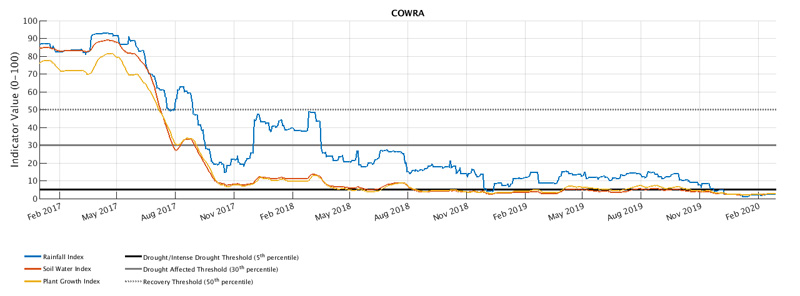
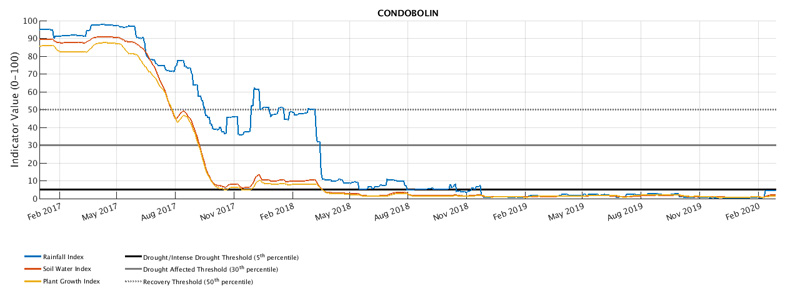
, Central West (Condobolin), and Hunter (Singleton).")
South East region
The South East Local Land Services (LLS) region experienced a reduction in the area categorised as Intense Drought during February. This is due to the rainfall received across parts of the region over the last two months. Despite this, the region is still categorised as being in one of the three Combined Drought Indicator (CDI, Figure 25) drought categories. This reflects the extent of on-going drought conditions that have been experienced and that the soil moisture and plant growth indicators are slow or need more rain to respond.
The monthly NDVI anomaly data (Figure 26) indicates widespread below normal levels of greenness compared to the long-term expectations. This has been driven by insufficient rain and poor agronomic activity over the past few months. The impact from the severe bushfires in recent months is also evident in the NDVI data. The response to the recent rainfall is still occurring and expected to take more time.
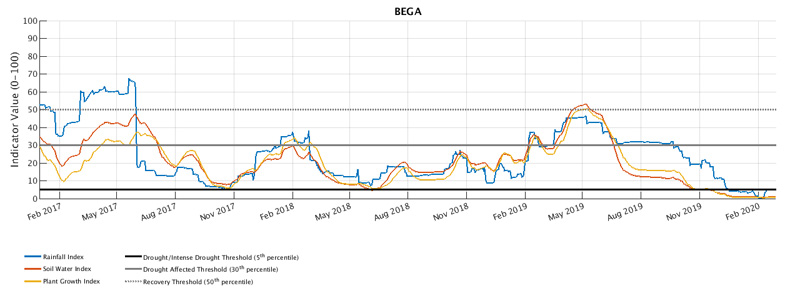
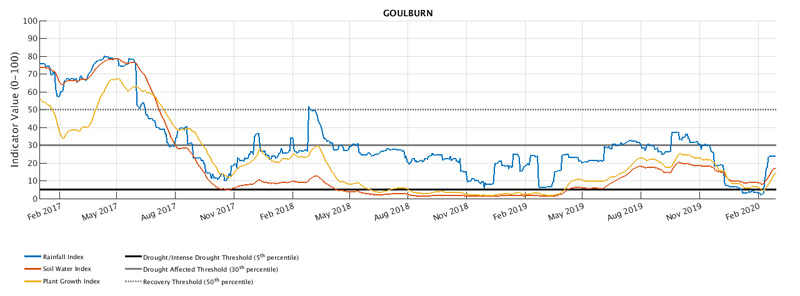
The time series charts (Figure 27) show the individual response of the drought indices at Bega, Goulburn and Cooma. Except for Bega, there has been an improvement to the indicators in February. More time is needed to assess the longer-term response in the soil water and plant growth indicators. Bega shows an example of a false recovery between March and June 2019. This highlights the need for sustained follow-up rainfall to initiate long-term drought recovery.


Official national outlook
The official National Climate Outlook was released by the Bureau of Meteorology (BoM) on 5 March 2020. Large areas of Australia have a slightly increased chance of being wetter than average including; most of Western Australia, parts of the Northern Territory, South Australia, southern NSW, parts of Victoria and northwest Tasmania. Elsewhere the likelihood of a wetter or drier than average April to June remain equal.
Daytime temperatures are likely to be above average across most of Australia, except in southern Western Australia, southern South Australia and western Victoria where there are near equal chances of hotter or cooler day time temperatures. Overnight temperatures are likely to be warmer than average for most of Australia.
NSW outlook
NSW is forecast to have a slightly wetter to near equal chance of receiving wetter than average conditions during April to June (Figure 28). While recent rainfall has helped ease conditions in parts of NSW, long-term rainfall deficiencies continue. Continued rainfall is needed to replenish soil water, improve farm water supplies and allow for pasture recovery. The historical rainfall outlook accuracy for the forecast period is moderate for most of NSW.

The BoM temperature outlook for April to June (Figures 29 & 30) indicates higher chances of warmer than average daytime, especially in the north east and coastal regions. Overnight temperatures also have higher chances of being warmer than average for the majority of NSW.


Climate drivers
El Niño–Southern Oscillation (ENSO)
The Bureau of Meteorology’s (BoM) El Niño–Southern Oscillation (ENSO) Outlook was released on 3 March 2020. All ENSO indicators in tropical Pacific Ocean remain neutral. International climate models indicate that ENSO is likely to remain neutral through May and have little influence on Australian climate. ENSO predictions starting in autumn tend to have lower accuracy than at other times of year, meaning that current forecasts beyond May should be used with caution.
Southern Oscillation Index
The average Southern Oscillation Index (SOI) for the 30 days ending 1 March 2020 was –2.1. The 90-day value was -2.2. Sustained negative values of the SOI below −7 typically indicate El Niño while sustained positive values above +7 typically indicate La Niña. Values between +7 and −7 generally indicate neutral conditions.
 to 2 February 2020")
Sea surface temperatures
Monthly sea surface temperatures remained warmer than average across much of the western equatorial Pacific Ocean during February (Figure 32). Sea surface temperatures were also warmer around most of Australia during February. Anomalously warm SSTs in the western Pacific near the dateline may be reducing the impact of the warm SSTs around Australia, which would typically promote synoptic rainfall.
The February values of the three key NINO indices in the tropical Pacific were: NINO3 +0.1°C, NINO3.4 +0.53°C and NINO4 +0.8°C. Persistent NINO3 or NINO3.4 values warmer than +0.8 °C are typical of El Niño, while persistent values cooler than −0.8 °C typically indicate La Niña.
")
Sea sub-surface temperatures
The four-month sequence of equatorial sub-surface temperature anomalies (to February) shows the top 150 m of the equatorial Pacific is warmer than average between about 150°E and 150°W, reaching up to three degrees warmer than average. Slightly cooler than average waters are present at a depth of around 50 to 150 m across most of the remainder of the equatorial Pacific.
The pattern has remained somewhat similar since November, with mostly weak to moderate temperature anomalies.
")
Indian Ocean
The Indian Ocean Dipole (IOD) is neutral. The IOD typically has little influence on Australian climate from December to April. When the monsoon trough shifts southwards into the southern hemisphere at this time of year, it changes the broadscale wind patterns. This means that the IOD pattern is unable to form. The latest weekly value to 1 March was −0.29 °C.
Presently 2 of 6 international climate models indicate that a positive IOD may emerge during late autumn, however, the accuracy of IOD forecasts beyond autumn is low at this time of year.
Southern Ocean
The Southern Annular Mode (SAM) is currently neutral and expected to remain neutral. The SAM has little influence on Australian climate during autumn.
How does it work?
Much of the information in the Seasonal Conditions Report is sourced from the NSW DPI Enhanced Drought Information System (EDIS) ™. The EDIS system is currently available in prototype form and is subject to an intensive ground truthing process. For more information, visit DroughtHub.
EDIS is an ongoing project aimed at improving the quality and timeliness of efforts to monitor conditions across the state. Key features of the system are:
- It tracks drought by using four indicators; rainfall, soil water, plant growth, as well as tracing rainfall trends. Agronomic conditions have equal value to rainfall recorded at meteorological stations.
- The Combined Drought Indicator (CDI) brings this information together, and has been designed to characterise developing drought conditions. The key purpose for building the CDI was as a drought early warning system.
- The rainfall, soil moisture and plant growth indicators in EDIS account for conditions over a 12 month window. This provides a compromise between a highly sensitive indicator (e.g. six months) and a less sensitive indicator (e.g. 24 months).
- Climate and remote sensing data drive the information system at a high resolution, but the CDI is reported at a Parish level.
- Because of its configuration and purpose, there will be differences to the indicator used in the National Drought Monitoring Framework (the Australian Rainfall Deficiency Analyser) which relies on rainfall alone.
- The CDI has three drought categories that characterise NSW according to drought intensity as well as the main drivers of a drought event (meteorological, hydrological and agronomic). DPI considers areas Drought Affected to be experiencing a drought event.
- The Drought Affected category encompasses a wide range of conditions from the very early stages of drought entry through to a drought event becoming intense. This enables the drought monitoring system to detect a drought event early. It is also possible to stay in the Drought Affected category for some period of time.
The way in which the indicators are combined to form the CDI is described in Table 1 below.
Table 1: the way in which the indicators are combined to form the CDI
CDI Phase | Technical definition | Description - typical field conditions |
|---|---|---|
Intense Drought | All three indicators (rainfall, soil water, plant growth) are below the 5th percentile | Ground cover is very low, soil moisture stores are exhausted and rainfall has been minimal over the past 6-12 months. |
Drought | At least one indicator is below the 5th percentile | Conditions may be very dry, or agronomic production is tight (low soil moisture or plant growth). It is possible to be in Drought when there has been some modest growth, or a few falls of rain. |
Drought Affected (intensifying) | At least one indicator is below the 30th percentile and the rainfall trend is negative over the past 90 days. | Conditions are deteriorating; production is beginning to get tighter. Ground cover may be modest, but growth is moderate to low for the time of year. When indicators are close to the Drought threshold drought conditions are severe. |
Drought Affected (weakening) | At least one indicator is below the 30th percentile and the rainfall trend is positive over the past 90 days. | Production conditions are getting tighter, but there have been some falls of rain over the past month. It is rare to enter the Recovering phase from the Non-Drought category; Usually there is a quick (1-2 week) transition into Drought Affected or Drought. When indicators are close to the Drought threshold drought conditions are severe. |
Recovering | All indicators are below the 50th percentile but above the 30th percentile | Production is occurring but would be considered ‘below average’. Full production recovery may not have occurred if this area has experienced drought conditions over the past six months. |
Non-drought | At least one indicator is above the 50th percentile. | Production is not limited by climatic conditions. |
The NSW State Seasonal Update is provided each month by the NSW DPI Climate Branch.
Information used in this report was primarily sourced from the Australian Bureau of Meteorology, the US National Oceanic and Atmospheric Administration, the International Research Institute for Climate and Society (Columbia University), Geoscience Australia’s Digital Earth Australia Program, and NSW Department of Primary Industries.
Maps in this document contain data which is © Spatial Services – NSW Department of Finance, Services and Innovation (2020), Panorama Avenue, Bathurst 2795 and data which is © Commonwealth of Australia 2020, Australian Bureau of Meteorology, Melbourne. All rights reserved.
The seasonal outlooks presented in this report are obtained from the Australian Bureau of Meteorology and other sources (including World Meteorological Organisation Global Producing Centres). These outlooks are general statements about the likelihood (chance) of (for example) exceeding the median rainfall or minimum or maximum temperatures. Such probability outlooks should not be used as categorical or definitive forecasts, but should be regarded as tools to assist in risk management and decision making. Changes in seasonal outlooks may have occurred since this report was released.
All climate and remote sensing input data is supplied to the Enhanced Drought Information System ™ under the Australian Creative Commons Licence (CCY 4.0) and is made available by the Terrestrial Ecosystem Research Network.
© State of New South Wales through the Department of Industry, Skills and Regional Development, 2020. You may copy, distribute and otherwise freely deal with this publication for any purpose, provided that you attribute the NSW Department of Primary Industries as the owner.
Disclaimer: The information contained in this publication is based on knowledge and understanding at the time of writing (January 2020). However, because of advances in knowledge, users are reminded of the need to ensure that information upon which they rely is up to date and to check currency of the information with the appropriate officer of the Department of Primary Industries or the user’s independent adviser.
Published by the NSW Department of Primary Industries. ISSN 2202-1795 (Online). Volume 8 Issue 2.
