

NSW State Seasonal Update - August 2023
Prepared by NSW DPI
NSW overview
The NSW DPI Combined Drought Indicator (CDI) shows 91% of NSW is in the Non-Drought category at the end of August. The production outlook remains strong for many parts of NSW, particularly to the south and some areas in the west of the state.
Drought conditions are continuing to expand and intensify on the North Coast, Northern Tablelands, Hunter and the South East Local Land Services (LLS) Regions of NSW. These conditions are consistent with the onset of a major drought in these regions, and the drought indicators show that the area of this event is growing across the Northern Tablelands and North-West. Producers are continuing to monitor on-ground conditions and climate forecasts closely, while implementing actions in line with their individual drought strategies.
Current conditions
- August rainfall was below average, and concentrated largely in central, eastern, and southern NSW, with some areas receiving up to 50mm.
- Dry conditions continue to impact parts of the state leading to a continued strong decline in plant growth and soil water in the Hunter, north, north-east, and south-east of NSW. On ground reports reflect this, with producers reporting that they are managing feed deficits.
- While only a small area of the state currently falls into one of the CDI drought categories, weak to strong drying trends are evident across the state leading to a decline in all drought indicators for many areas. The DPI continues to closely monitor conditions and encourages producers to seek advice where needed to minimise impact on production and farm operations.
- August maximum temperatures were high across NSW, with anomalies of 1-4 oC above the long-term average. This is consistent with the extremely warm conditions being observed across the globe over the last month.
- Water availability for irrigated production remains adequate, with many irrigation storages at near full capacity.
- For further information on each LLS region, see the Regional Breakdown section in this Update.
Seasonal Climate Outlook
- Seasonal climate forecasts indicate increased likelihood of warmer than average daytime and overnight temperatures for most of NSW for the September to November period.
- Rainfall has an increased likelihood of being below average to well below average for most of NSW for the next three months.
- The ENSO Outlook status remains at El Niño ALERT. When El Niño ALERT criteria have been met in the past, an El Niño event has developed around 70% of the time.
- The Indian Ocean Dipole (IOD) is currently positive.
The CDI and its individual rainfall, soil moisture and crop/pasture growth metrics are leading biophysical indices of seasonal conditions and drought status. Other factors affecting production and economic responses usually lag the CDI. Further information about the correct interpretation of the CDI at a region and industry level is provided in the regional breakdown section of this report .
Support Services
Producers and members of rural communities are encouraged to maintain contact with their local professionals who can facilitate access to appropriate support. More support information is available at: droughthub.nsw.gov.au.

It is important to recognise the CDI provides an aggregated view of NSW, and that on-ground conditions can be different to those displayed in the maps. They provide an ‘on average’ view of a particular region only.
Rainfall
Rainfall was variable during August with most regions receiving between 5mm and 50mm of rainfall. The highest monthly rainfall totals (above 50mm) were recorded in the southern tableland regions of NSW and parts of coastal NSW (Figure 2a). Large areas in the Western LLS region received less than 5mm of rainfall.
For the calendar year to date, eastern NSW has received between 200 to 600mm of rainfall. Areas around Coffs Harbour and the southern highlands have received more than 800mm. West of the Great Dividing Range has generally received rainfall between 200mm and 400mm (Figure 2b). Year to date rainfall has been average, to below average for most of NSW.
The rainfall anomaly data shows the difference between total August monthly rainfall and the long-term average monthly rainfall (1981 – 2010; Figure 2c). Most of NSW has recorded a negative rainfall anomaly for August. Positive rainfall anomalies were recorded for small areas in the Hunter Local Land Services (LLS) region, near Wollongong and to the west of Balranald in Western NSW. The small positive rainfall anomalies for August are not sufficient to reverse the 6-9 month drying trend being experienced in the Hunter region.


Temperature
In August, the average maximum temperatures ranged from 3°C in the southern alps to above 24°C in the northwest of NSW (Figure 3a). Most of NSW ranged between 12°C and 21°C during August.
Near average to above average maximum temperatures were experienced across most of NSW in August (Figure 3b). Maximum temperatures were generally between 1°C and 4°C above average.
Minimum temperatures were generally between 0° and 6°C for most of NSW. The alpine region ranged between -3°C to 0°C. The warmest temperatures were along parts of coastal NSW and the far northwest of the state (Figure 3c).
Minimum temperatures anomolies were more than 1°C above average in the far northwest of NSW and some alpine regions (Figure 3d). Minimum temperatures were more than 1°C below average in parts of the western Central West, Riverina, and Murray LLS regions.
The number of frost days in August has decreased from those experienced in July. The alpine and northern tableland regions experienced the highest number of frost days during August (Figure 3e).


Normalised Difference Vegetation Index (NDVI) Anomaly
The seasonal Normalised Difference Vegetation Index (NDVI, Figure 4) indicates that plant greenness levels are variable across NSW. Many areas continue to have above normal plant greenness levels, with. areas of below average plant greenness emerging across NSW. Regions where there more pronounced zones of below normal greenness are the Central West, Hunter, North West, South East, North Coast and Western Local Land Services areas. Some of the extremely negative NDVI areas (brown patches) are water bodies. The monthly NDVI analysis has a closer resemblance to on-ground physical observations than long term drought indices like the CDI which summarise the last 12 months.

NSW Farm Dam Survey
The NSW Farm Dam Survey has not been updated this month because of technical data acquisition issues. Last month’s figure is shown (Figure 5a), where dam levels were generally stable compared to the previous Update in June. Higher farm dam levels were present across many parts of central, eastern and southern NSW. Low dam levels were evident along the NSW coast and hinterland. Large areas of Western NSW have dam levels below 60% capacity. Gaps in the figure is due to missing input data for some areas of NSW.

NSW DPI Farm Tracker Reports
NSW DPI Farm Tracker Application reports are completed by users across NSW. On the ground reports submitted on the NSW DPI Farm Tracker application (Figure 5b) show producers in several regions are reporting they are managing moderate to very severe drought conditions in August.
![]()
The Farm Tracker application is freely available and can be used to help monitor seasonal conditions on your property. Completing a report allows a user to create a geotagged photo diary, monitor dam levels, or record changes at an individual paddock level.
This information provides a detailed and visual record of a farm over time that can be invaluable for budgeting, planning and decision making. The data collected for each farm is not available for other people to see or search.
Reports are also used by NSW DPI as a highly valuable information source to ground truth products from the DPI Seasonal Conditions Monitoring Program.
Search for NSWDPI Farm Tracker and download the application from your app store.
Soil Water Index
The Soil Water Index (SWI, Figure 6) shows conditions are variable across NSW. Parts of the North Coast, North West, Hunter and South East LLS regions are showing Below Average to Extremely Low soil water values. The area in the Average category has expanded since the July Update. Substantial rainfall in many areas is needed to trigger an improvement in the SWI.
 to 31 August 2023")
Plant Growth Index
The Plant Growth Index (PGI, Figure 7) shows that most of NSW remains in the Average to Above Average PGI category. The area in the Below Average category on the North Coast, Northern Tablelands and Hunter has expanded since the July Update. There is the potential that more areas will transition into the Below Average category during August.
 to 31 August 2023")
Rainfall Index
The Rainfall Index (RI, Figure 8) shows that most of south west and central NSW remains in the Average to Extremely High category. The area in the Below Average to Extremely Low categories has expanded in the northeast and Hunter region since the July Update. This is confirmed by on ground reports that producers are managing feed deficits due to rainfall deficits and low stored soil water in parts of NSW.
 to 31 August 2023")
Drought Direction Index
The Drought Direction Index (DDI, Figure 9) tracks the 150-day trend of daily rainfall totals. Western NSW is generally showing a neutral trend due to rainfall over the past few months. In contrast, much of South East, North Coast, Hunter and parts of the Riverina LLS regions have recorded a strong drying trend during August.
A weak drying trend has been recorded for most of central NSW. Areas in the Weak Drying Trend category have experienced a slightly drier July and August compared to previous months. The strong drying trend along the east coast and northern tablelands has been influenced by the high starting point for the trend, high rainfall recorded in late 2022 and the comparatively drier conditions over the last few months.
 to 31 August 2023")
Changes in the individual drought indicators may have occurred since this update was released. For the most current information, please visit DroughtHub.
NSW outlook - July to September
(issued 31 August 2023)
Dry spring forecasted for much of NSW
- The seasonal rainfall outlook indicates that there is a 50% to 80% chance of below median rainfall across most of NSW during the September to November period (Figure 10).
- Parts of the Murray LLS region have a greater than 80% chance of below median rainfall over the next three months.
Warm to hot season forecasted for NSW
- The maximum temperature outlook indicates a more than 80% chance of exceeding median daytime temperatures across NSW during the September to November period (Figure 11).
Warmer nights across NSW
- There is an above 80% chance of warmer than median overnight temperatures across most of eastern, central and southern NSW during the September to November period (Figure 12).
- Across western NSW there is a 55% to above 70% chance of above median overnight temperatures.


Official national outlook
The official national outlook was released by the Bureau of Meteorology on 31 August 2023. The rainfall outlook for September to November shows that most of Australia has a likely to very likely (60% to 80%) chance of below median rainfall.
Maximum temperatures for September to November have a very likely chance (greater than 80%) of being warmer than average for most of Australia. Minimum temperatures for the September to November period have a likely to very likely (60% to greater than 80%) chance of being warmer than average for most of western and southern Australia.
Forecast accuracy at this time of year has generally been moderate to high for most of Australia. The Bureau issues a new 3-month seasonal update weekly, each Thursday afternoon.
Global climate drivers
El Niño–Southern Oscillation (ENSO)
The Bureau of Meteorology’s El Niño-Southern Oscillation (ENSO) Outlook was released on 29 August 2023. The ENSO Outlook status remains at El Niño ALERT.
Sea surface temperatures (SSTs) in the tropical Pacific Ocean are exceeding El Niño thresholds. The Southern Oscillation Index (SOI) is negative. Atmospheric indicators (E.g., trade winds, cloudiness) have not reached El Niño thresholds. This indicates that the Pacific Ocean and atmosphere have yet to become fully coupled, a criterion the Bureau uses to signify an El Niño event.
Models indicate a high likelihood of further ocean warming, with SSTs remaining above El Niño thresholds until at least early 2024. The Bureau of Meteorology’s El Niño ALERT indicates a 70% chance of El Niño occurring in 2023.
Southern Oscillation Index
The 30-day Southern Oscillation Index (SOI; Figure 13) for the 30 days ending 27 August was -11.0. The 90-day SOI value was -6.0. Sustained negative values of the SOI below −7 typically indicate El Niño while sustained positive values above +7 typically indicate La Niña.

Sea surface temperatures (SST)
Monthly sea surface temperatures (SST) were warmer than average across most of the tropical Pacific Ocean (Figure 14). Warm SST anomalies persist along the Australian coastline. Warm anomalies also remain in the southern Tasman Sea.
The latest values of the three NINO indices in the tropical Pacific for the week ending 27 August were: NINO3 +1.94 °C, NINO3.4 +1.27 °C, NINO4 +1.12 °C (sourced from the Bureau of Meteorology on 30 August 2023).
Persistent NINO3 or NINO3.4 values warmer than +0.8 °C are typical of El Niño, while persistent values cooler than −0.8 °C typically indicate La Niña.
")
Sub-surface sea temperatures
The four-month sequence of equatorial Pacific sub-surface temperature anomalies (to 24 August 2023) shows warm anomalies across most of the Pacific basin for the top 100m in depth (Figure 15). These warm anomalies reached more than 3oC above average for the eastern Pacific.
")
Indian Ocean (IOD)
The Indian Ocean Dipole (IOD) is currently above the positive IOD threshold. The latest weekly value of the Indian Ocean Dipole (IOD) index to 27 August 2023 was +1.05°C. This is the second week above the positive IOD threshold (+0.40 °C). However, several more weeks of positive values are needed to have confidence that a positive IOD event will occur.
All of the international climate models surveyed by the Bureau of Meteorology suggest a positive IOD event is likely to develop in spring. A positive IOD occurs at values greater than +0.4 °C and can suppress winter and spring rainfall over much of Australia, including NSW.
Southern Ocean (Southern Annular Mode – SAM)
The Southern Annular Mode (SAM) index is neutral (as of 28 August). It is expected to become slightly negative before returning to neutral during September (Figure 16).
The Southern Annular Mode (SAM) refers to the north-south shift of rain-bearing westerly winds and weather systems in the Southern Ocean compared to their usual position. This indicator can be quite volatile and generally influences weather conditions on 1 to 3 week timescales. A neutral SAM has little influence on Australian rainfall.
 Daily Index and Forecast Summary (Source: Australian Bureau of Meteorology on 30 August 2023)")
CDI status for the regions
Figure 17 displays the CDI status for each individual Local Land Services (LLS) region to 31 August 2023. The following regional descriptions are based on data available until the end of August 2023.

Murray and Riverina regions
Murray and Riverina Regions production outlook remains strong
- The Riverina and Murray Local Land Services (LLS) regions remain in the Non-Drought category at the end of August (CDI, Figure 18).
- August rainfall was below average for most of the region.
- The seasonal NDVI anomaly data (Figure 19) shows that most of the Murray and Riverina regions were experiencing normal to higher than normal plant greenness levels for the June to August period. This is a likely a result of vegetation responding to recent widespread rainfall events. Some of the extremely negative NDVI areas (brown patches) represent water or fallowed paddocks.
Drought indicators remain stable
- The Drought History charts (Figure 20) show the individual response of the drought indicators for Hay, Temora, Finley, and Moulamein.
- The indicators remain high at all locations and suggest a strong production outlook.
- To access a Drought History chart for your Parish, visit the Seasonal Conditions Information Portal.
The Combined Drought Indicator (CDI) is a tool that monitors drought conditions across NSW. The drought categories are based on assessing the response of three drought indicators: soil water, plant growth and rainfall. The indicators track the data over the past 12 months and show how the indices are tracking compared to long-term averages. The information provided in the map is aggregated to a Parish level and provides a regional assessment of conditions. Variability within and between farms is possible and this may not be reflected in the CDI map.


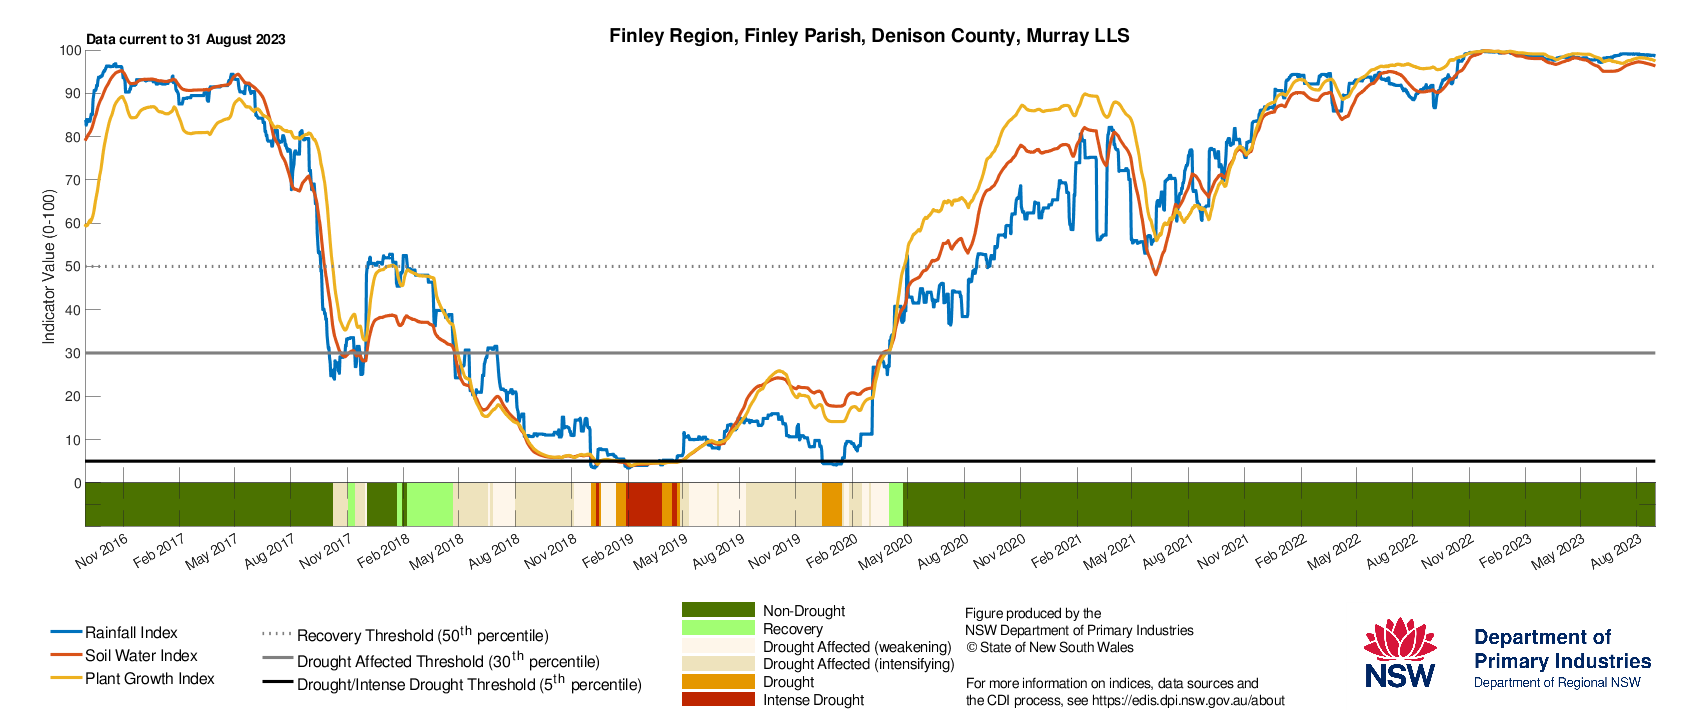
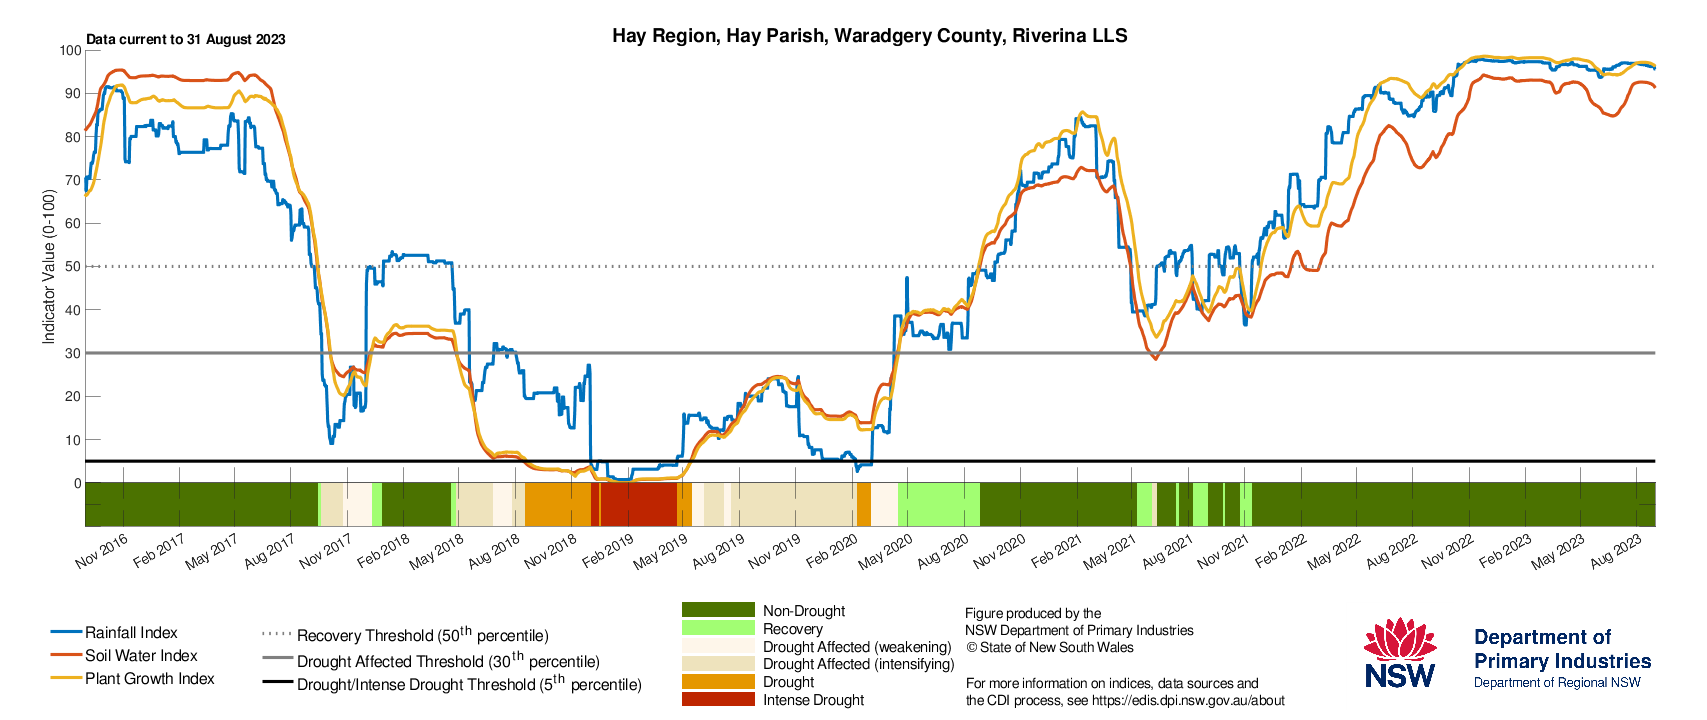
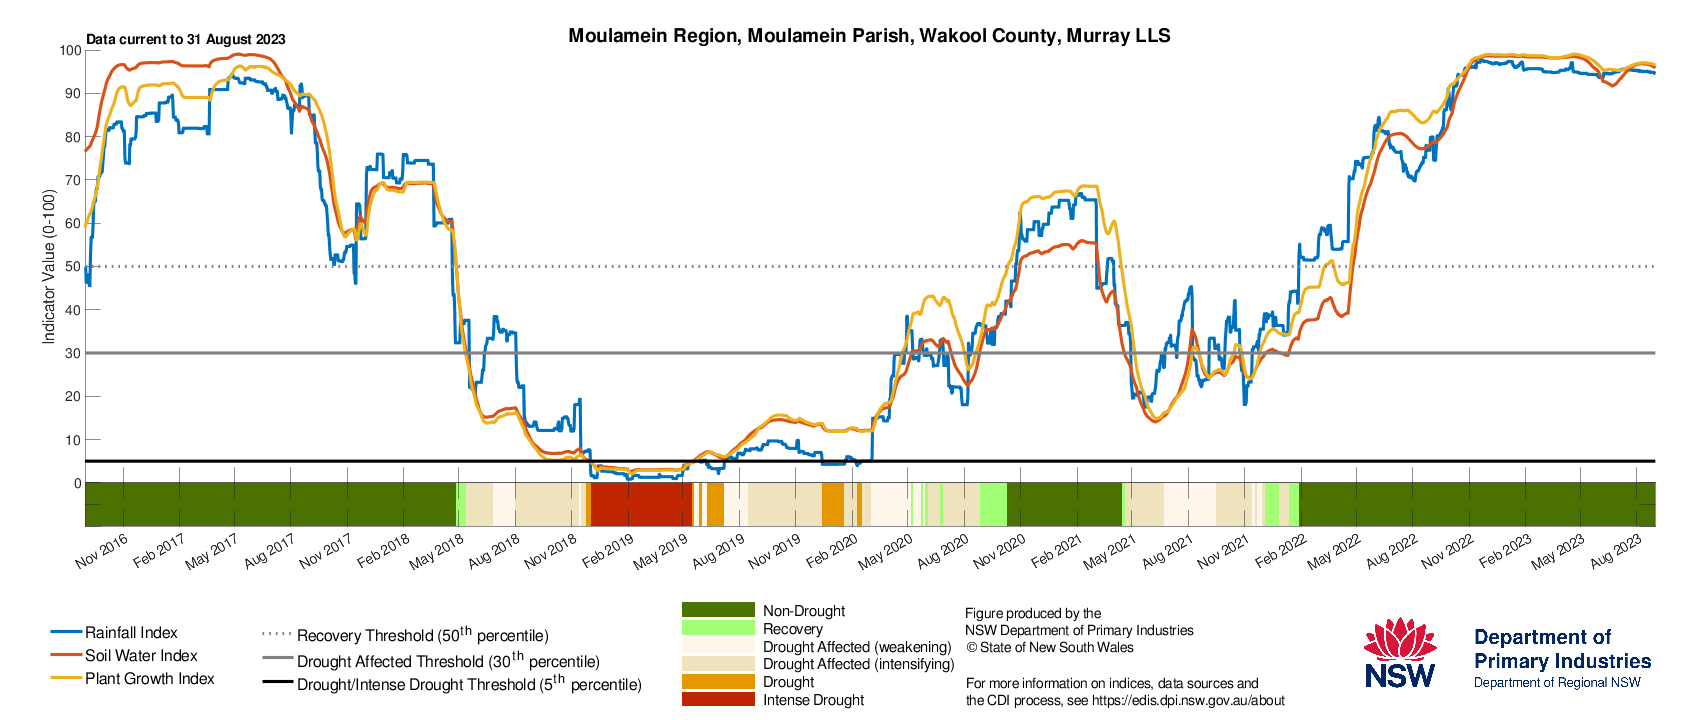
 & Murray (Finley, Moulamein) LLS regions show the current and historical status of the three drought indicators: Rainfall Index, Soil Water Index, and Plant Growth Index")
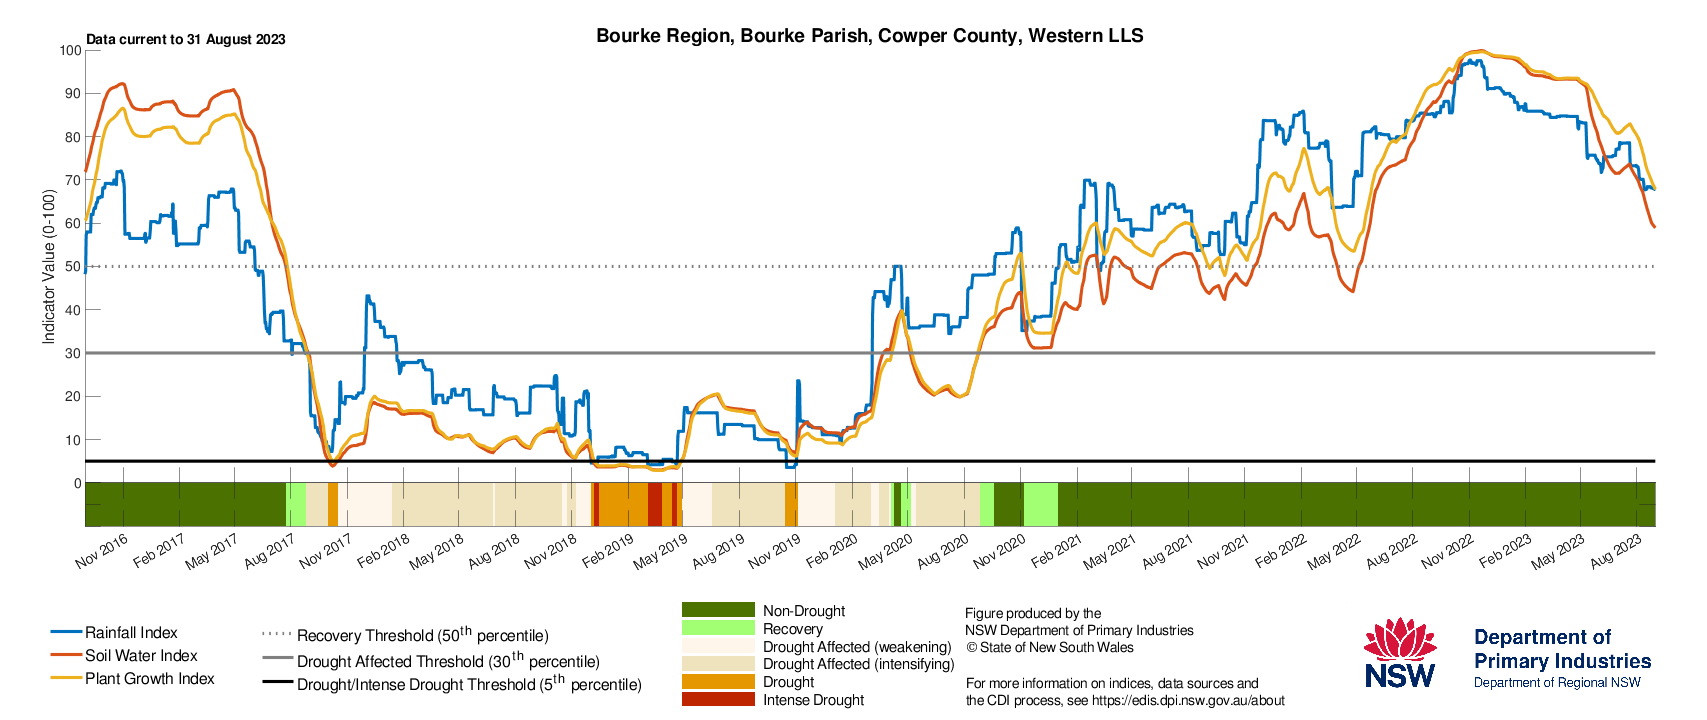
Western region
Western region producers should continue to monitor their seasonal conditions and forecasts closely in line with their production systems.
- The Combined Drought Indicator (CDI, Figure 21) shows that the Western LLS region is currently in the Non-Drought category.
- August rainfall was below average for most of the Western region.
- The seasonal NDVI anomaly data (Figure 22) shows normal to above normal levels of plant greenness across the LLS region for the June to August period as vegetation continues to respond to previous rainfall events.
- Below normal levels of greenness continue in the north-east and northern areas of the LLS region. Some of the extremely negative NDVI areas (brown patches) represent water.
Drought indicators remain stable for most regions
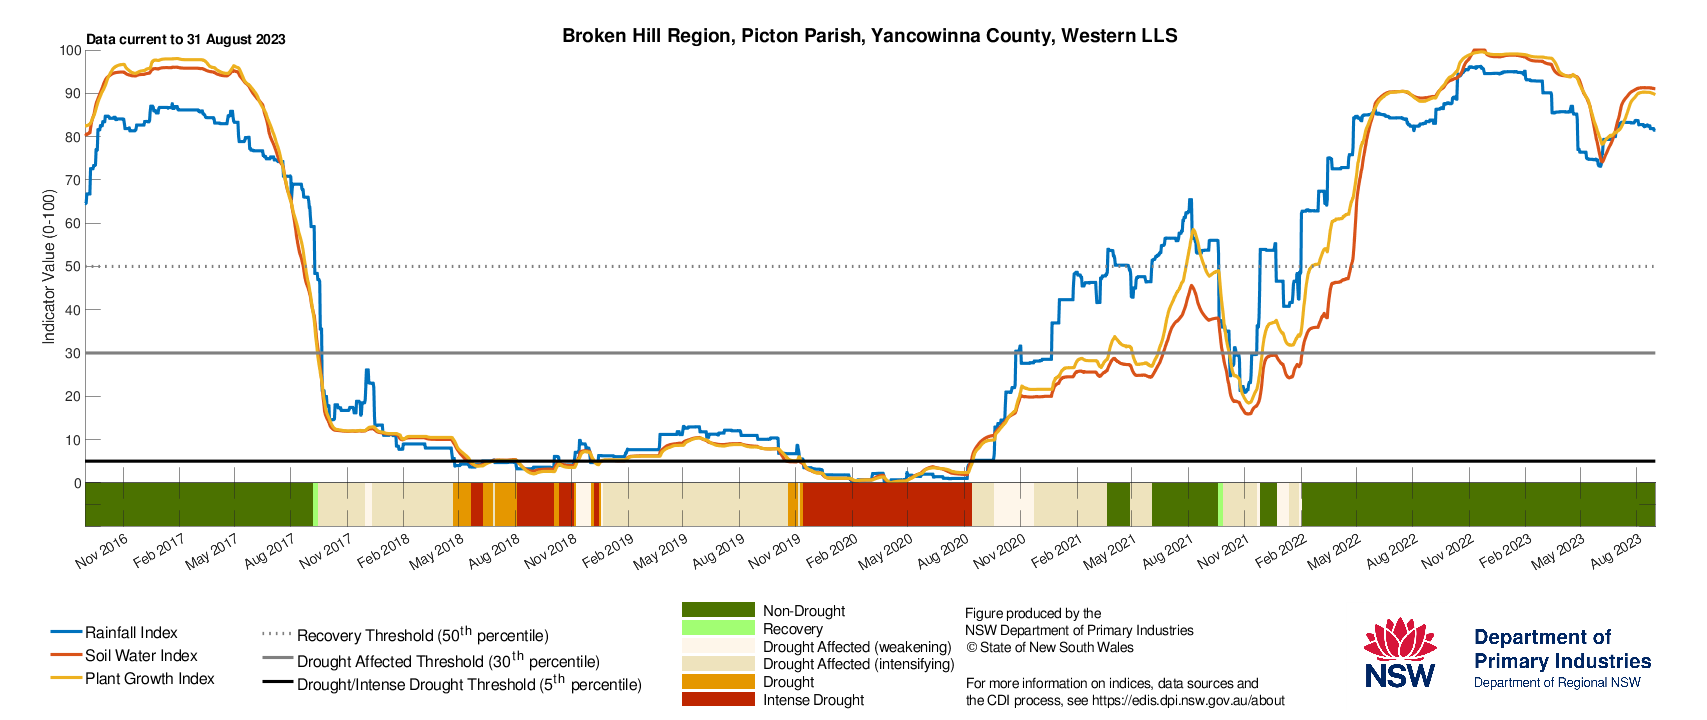
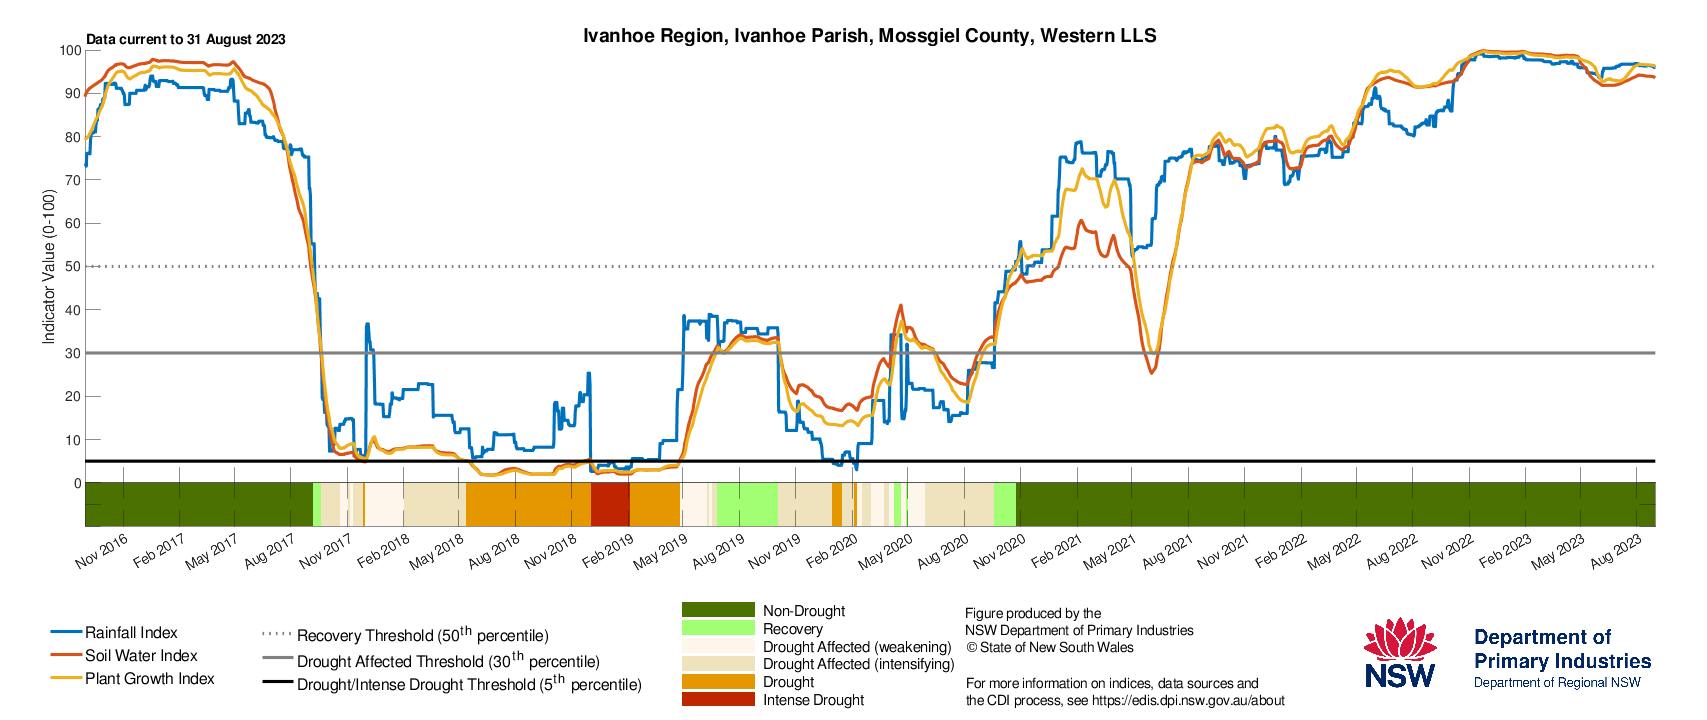
- The Drought History charts (Figure 23) show the individual response of the drought indicators for Bourke, Ivanhoe, Wentworth, and Broken Hill.
- Although still high, the rainfall, soil water and plant growth indicators have continued to decline at Bourke.
- Indicators remain high at Ivanhoe and Wentworth. Recent rainfall has seen indicators remain steady at Broken Hill.
- To access a Drought History chart for your Parish, visit the Seasonal Conditions Information Portal.
The Combined Drought Indicator (CDI) is a tool that monitors drought conditions across NSW. The drought categories are based on assessing the response of three drought indicators: soil water, plant growth and rainfall. The indicators track the data over the past 12 months. This shows how the indices are tracking compared to the long-term averages. The information provided in the map is aggregated to a Parish level and provides a regional assessment of conditions. Variability within and between farms is possible and this may not be reflected in the CDI map.


North West, Northern Tablelands and North Coast regions
A drought event continues to intensify, with producers focussing on short to medium term strategies (for their production systems) to manage livestock welfare and feed availability, and continue to assess their situation.
Producers should monitor conditions and forecasts closely and seek advice where needed to minimise impact on production and farm operations.
- The Combined Drought Indicator (CDI, Figure 24) shows most of the North West remains in the Non-Drought category at the end of August.
- The North Coast region has seen conditions decline with 70% of the region in one of the drought categories.
- The Northern Tablelands region has experienced a decline in conditions with the area in the Drought Affected category expanding since the last Update.
- August rainfall was below average for the three Local Land Services regions.
- The seasonal NDVI anomaly data (Figure 25) shows there is generally normal to above normal levels of plant greenness across eastern parts of the region. Large parts of the North West LLS region are experiencing lower than normal levels of plant greenness. The NSW DPI continues to closely monitor conditions in these regions.
Drought Indicators are in decline in all regions consistent with the onset or continuation of a drought event
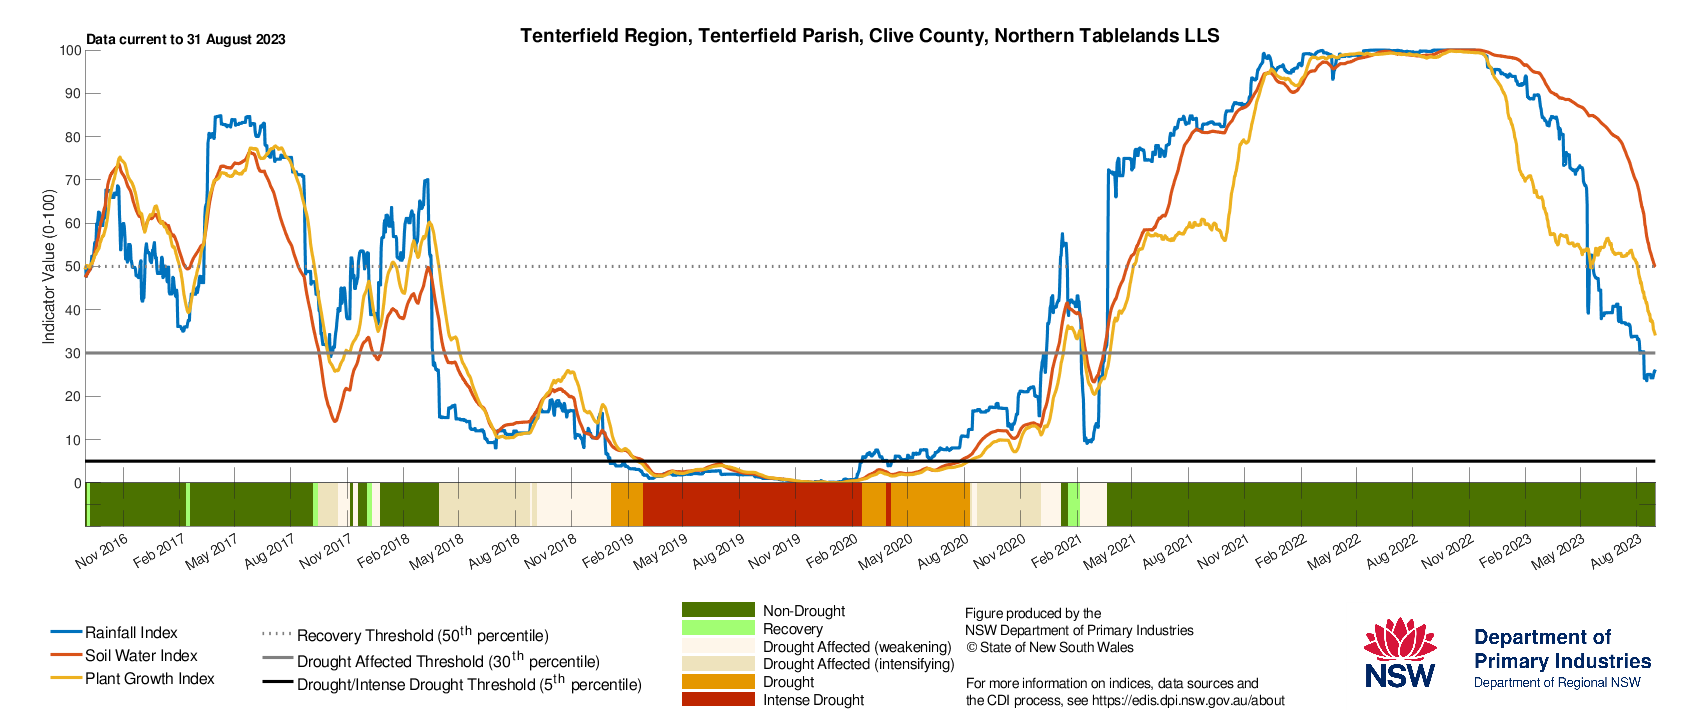
- The Drought History charts (Figure 26) show the individual response of the drought indicators for Tenterfield, Moree, Walgett, and Lismore.
- There has been a continued decline in the indicators at Moree and Walgett, however the regions remain in the Non-Drought category.
- Indicators have continued to decline at Tenterfield and is expected to transition into the Drought Affected category in the coming weeks.
- Indicators have declined around Lismore and this area has recently transitioned into the Drought Affected category.
- To access a Drought History chart for your Parish, visit the Seasonal Conditions Information Portal.
The Combined Drought Indicator (CDI) is a tool that monitors drought conditions across NSW. The drought categories are based on assessing the response of three drought indicators: soil water, plant growth and rainfall. The indicators track the data over the past 12 months and shows how the indices are tracking compared to the long-term averages. The information provided in the map is aggregated to a Parish level and provides a regional assessment of conditions. Variability within and between farms is possible and this may not be reflected in the CDI map.


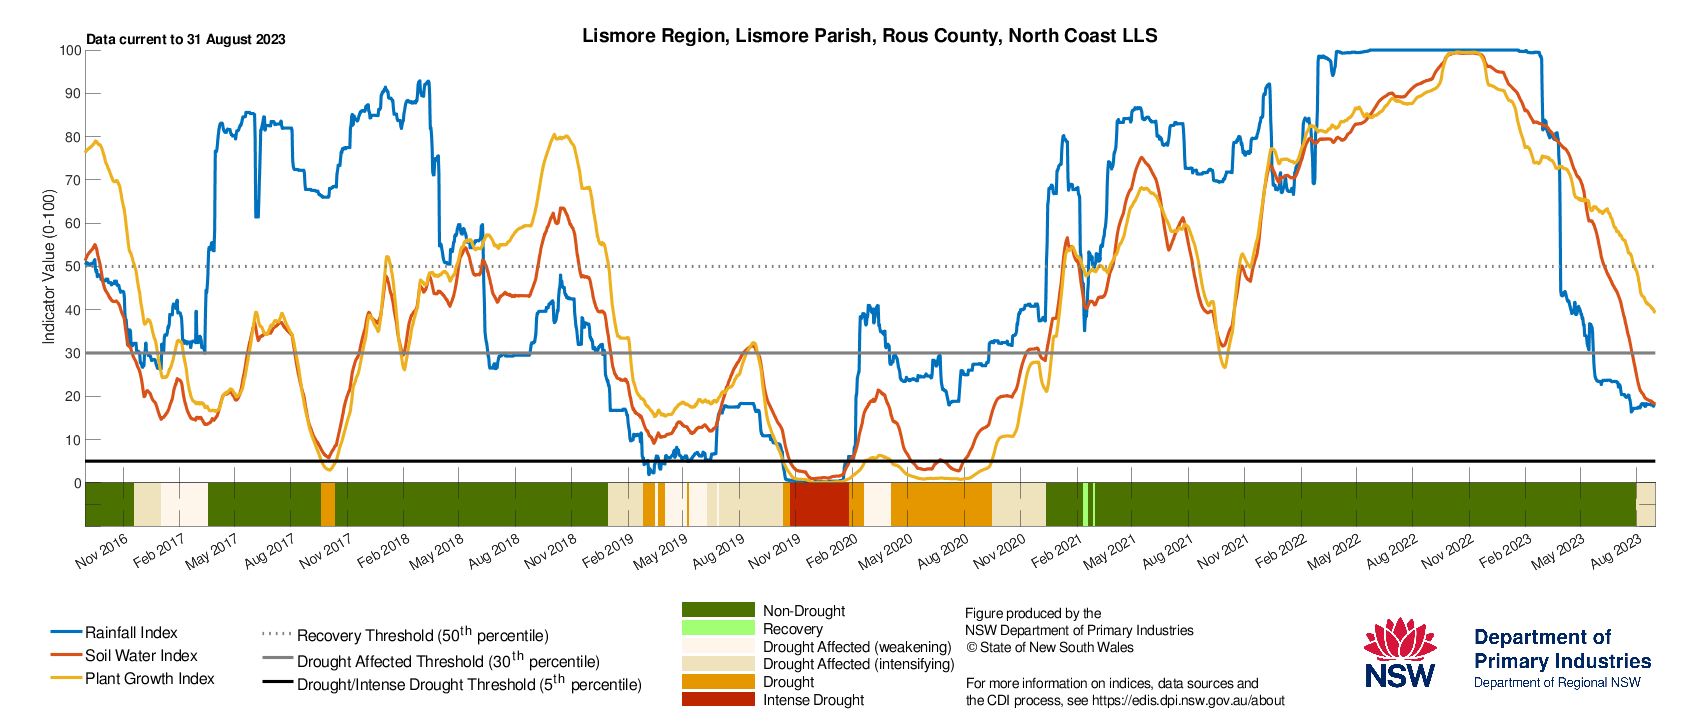
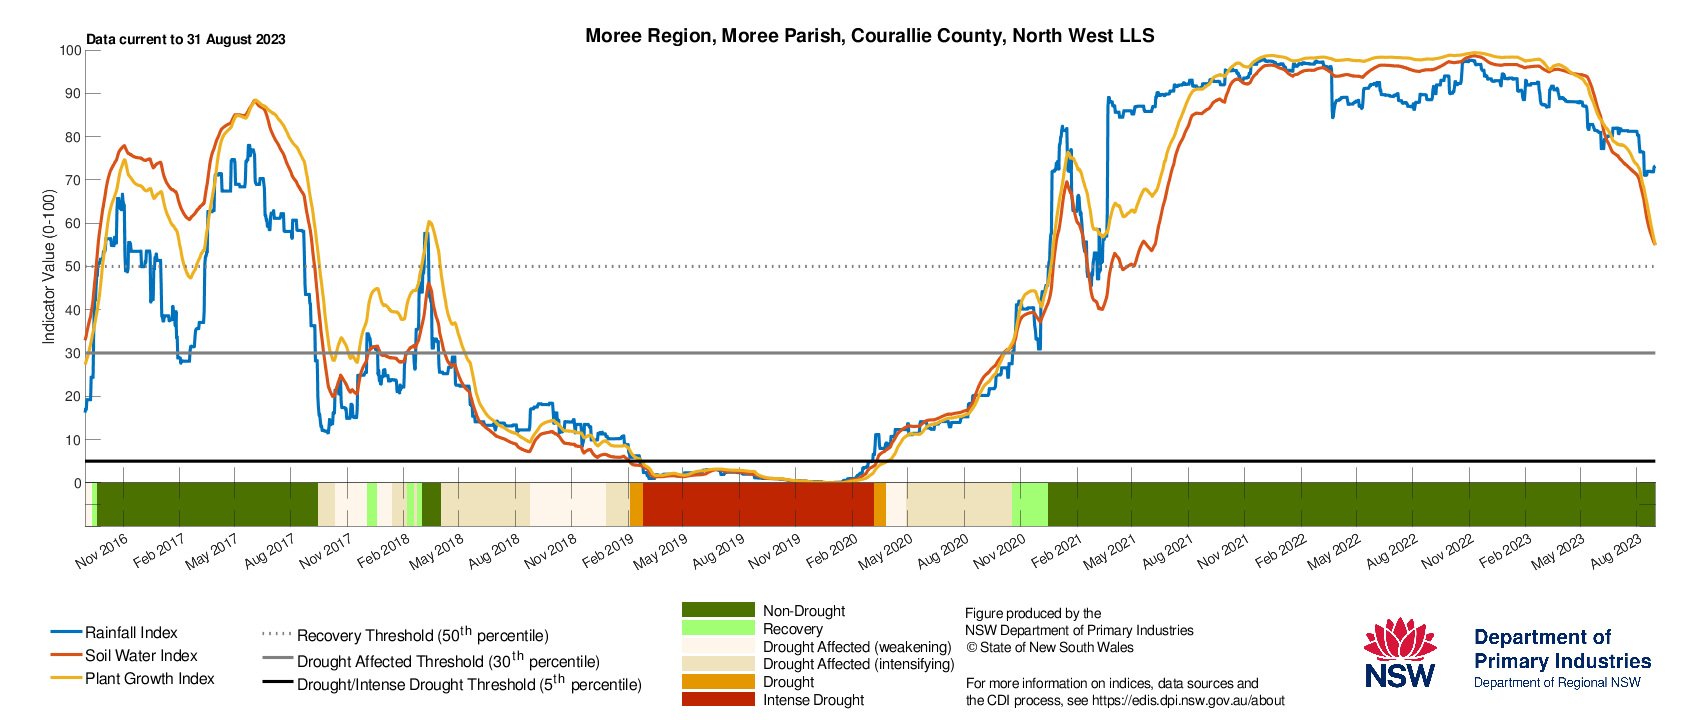
, North West (Moree & Walgett) and North Coast (Lismore) show the current and historical status of the three drought indicators: Rainfall Index, Soil Water Index, and Plant Growth Index")
Central Tablelands, Central West, Hunter and Greater Sydney regions
Hunter region is experiencing a drought event and producers are focussing on short to medium term strategies (for their production systems) to manage livestock welfare and feed availability, and continue to assess their situation.
Producers in other regions should monitor their seasonal conditions and forecasts closely, continue to assess management strategies and seek advice where needed to minimise impact on production and farm operations.
- The Combined Drought Indicator (CDI; Figure 27) shows that most of the Central West, Central Tablelands and Greater Sydney Local Land Services (LLS) regions continue to experience Non-Drought conditions at the end of August.
- The Hunter LLS region continues to manage a decline in conditions. At the end of August, 60% of the Hunter LLS region is in one of the drought categories. These CDI values indicate the regions has experienced 6-9 months of dry conditions. Further decline in the indicators is likely without any substantial rainfall.
- August rainfall was below average for most of the Central Tablelands, Hunter and Greater Sydney LLS regions.
- The seasonal NDVI anomaly data (Figure 25) shows that levels of plant greenness are variable across the regions. Large parts of the LLS regions are experiencing normal to above average plant greenness. Large area of the Central West and Upper Hunter are experiencing below average levels of greenness for the June to August period. Some of the extremely negative NDVI areas (brown patches) represent water.
- NSW DPI continues to closely monitor conditions in these regions.
Drought indicators continue to decline in the Hunter consistent with a drought event. Other regions remain stable, indicating good production outlooks.
- The Drought History charts (Figure 29) show the individual response of the drought indicators for Cowra, Condobolin, Singleton and Scone.
- There has been a decline in the CDI indicators at Scone and Singleton for the several months. The Scone region has recently transitioned into the Drought Affected category.
- The CDI indicators are currently high at Cowra and Condobolin. Producers in the region should monitor conditions in line with their production systems.
- To access a Drought History chart for your Parish, visit the Seasonal Conditions Information Portal.
The CDI is a tool that monitors drought conditions across NSW. The drought categories are based on assessing the response of three drought indicators: soil water, plant growth and rainfall. The indicators track the data over the past 12 months and show how the indices are tracking compared to the long-term averages. The information provided in the map is aggregated to a Parish level and provides a regional assessment of conditions. Variability within and between farms is possible and this may not be reflected in the CDI map.


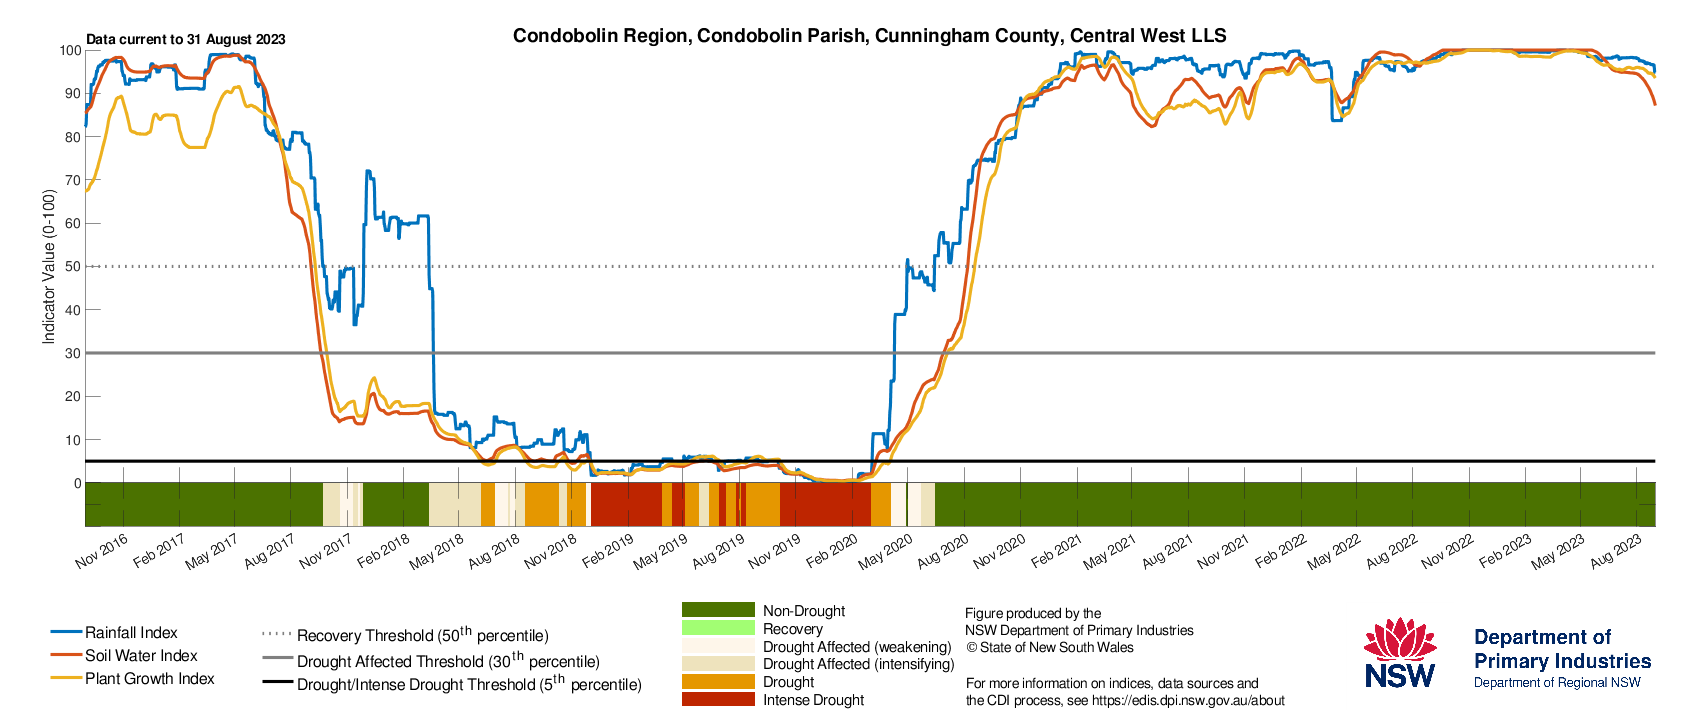
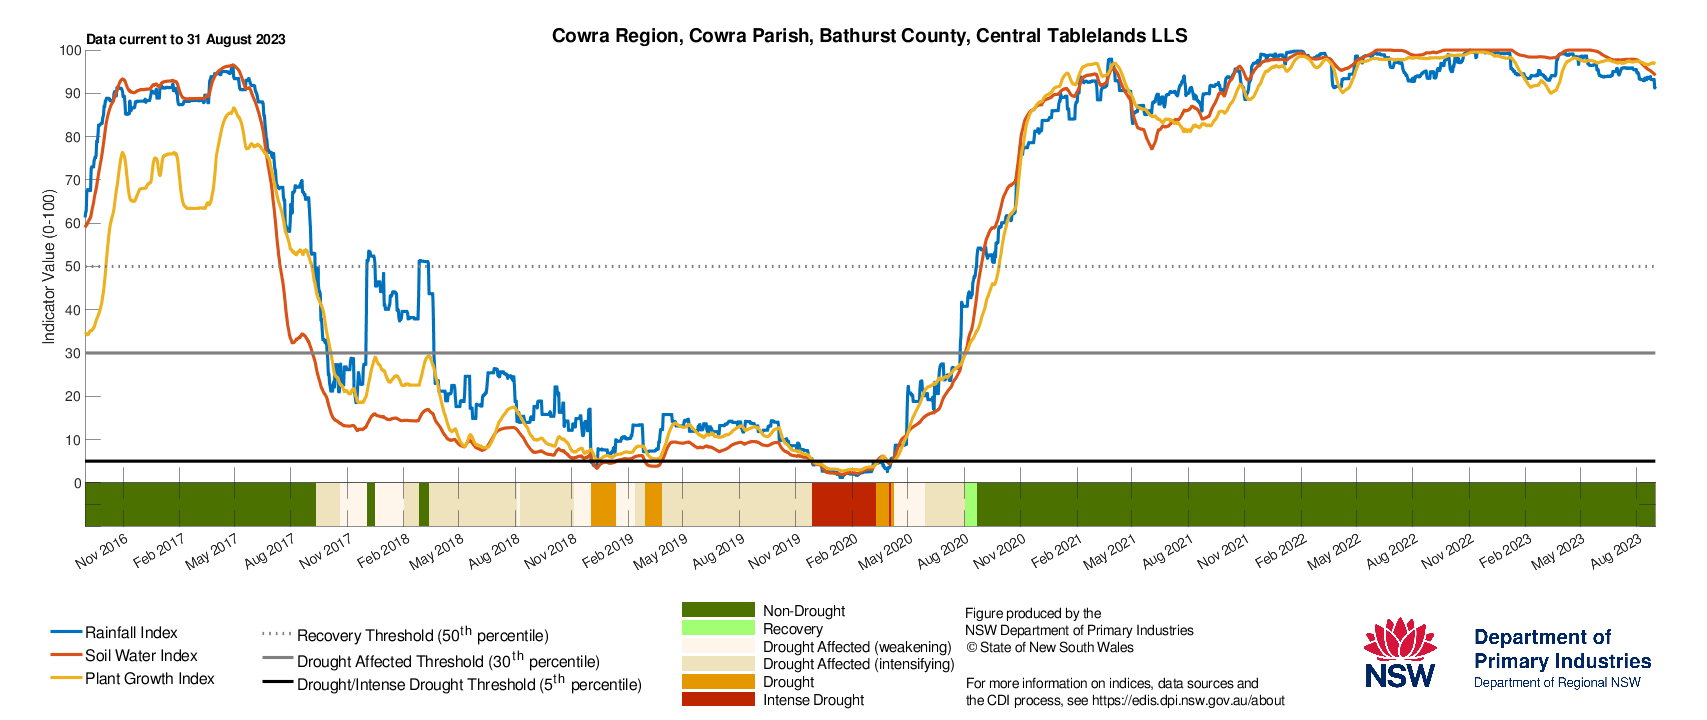
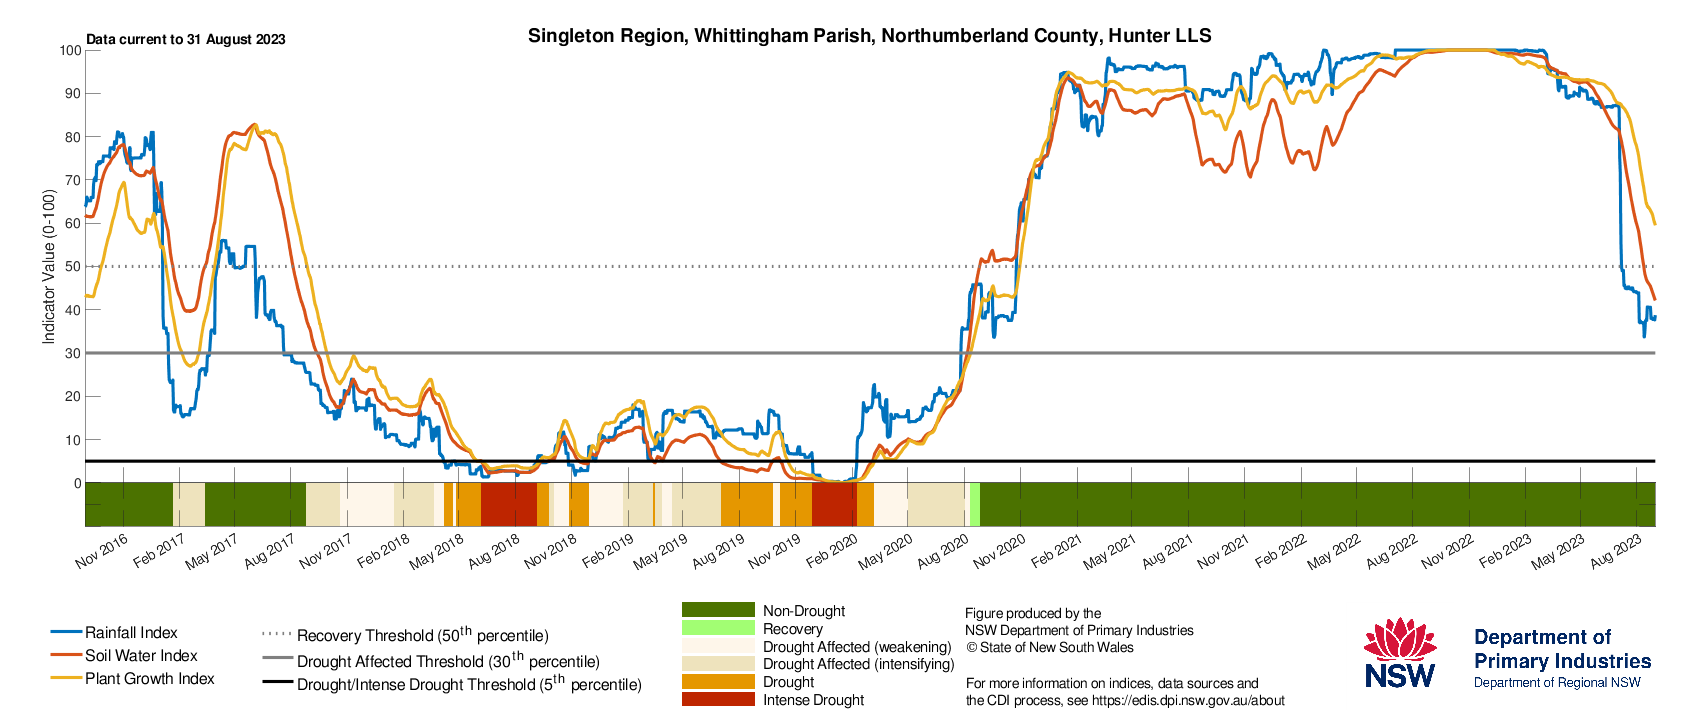
, Central West (Condobolin), and Hunter (Singleton and Scone) show the current and historical status of the three drought indicators: Rainfall Index, Soil Water Index, and Plant Growth Index")
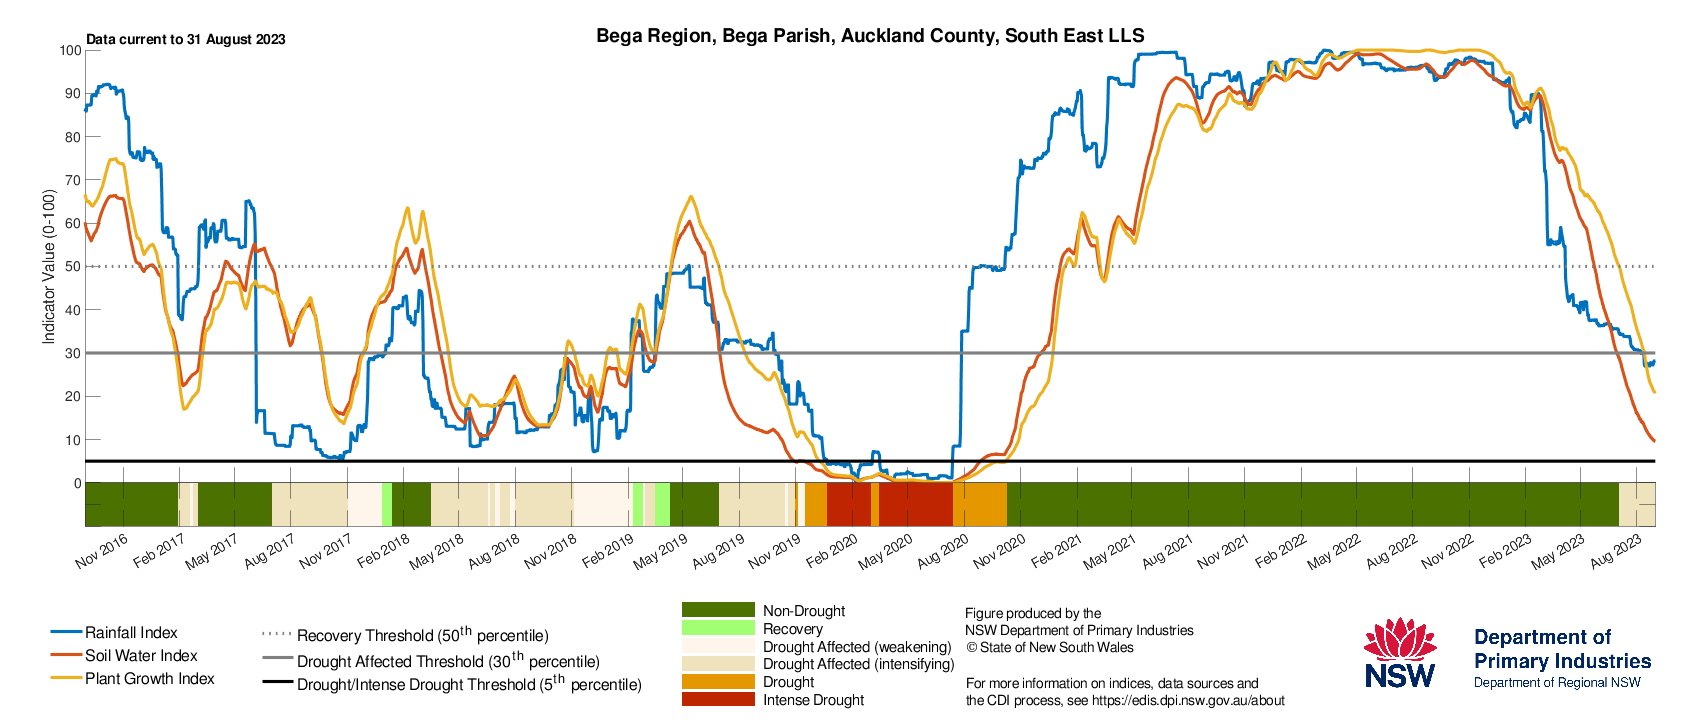
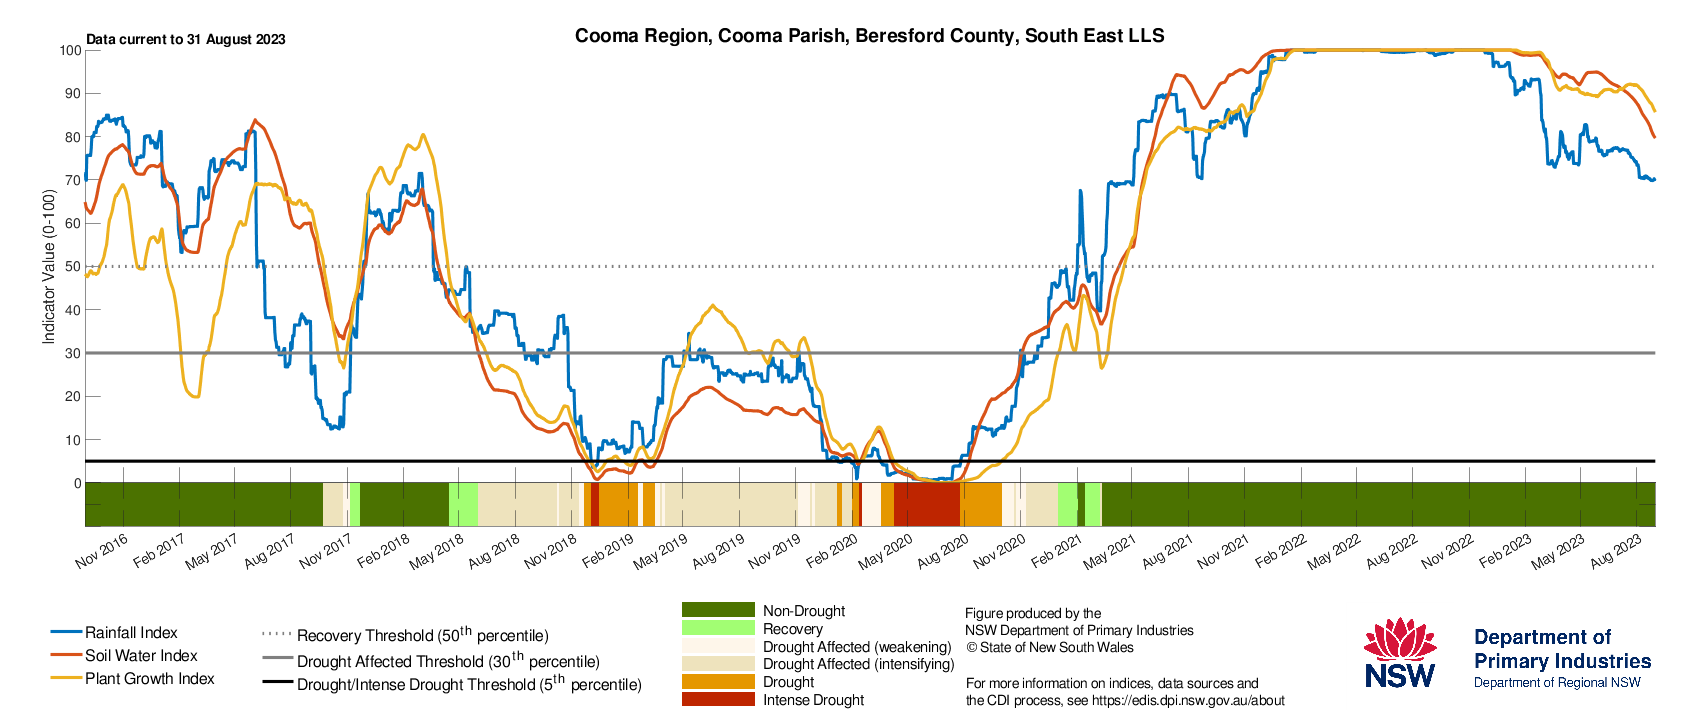
South East region
Parts of the South East region are experiencing an intensifying drought event and producers are focussing on short to medium term strategies (for their production systems), including irrigation, to manage livestock welfare and feed availability.
All producers in the region should continue to monitor their seasonal conditions and forecasts closely and seek advice as needed.
- The Combined Drought Indicator (CDI, Figure 30) shows that most of the South East Local Land Services region is in the Non-Drought category.
- The greater Bega region, which transitioned into the Drought Affected category in July has continued to expand. An area to the west of Nowra has also transitioned into the Drought Affected category since the last Update.
- Field reports indicate that dairy producers in the Bega region are relying on irrigation to maintain production.
- August rainfall was below average for most of the region and farm dam water levels are variable.
- The seasonal NDVI anomaly data (Figure 31) shows near normal to above average levels of plant greenness across most of the region. There are areas that have below average levels of greenness. Some of the extremely negative NDVI areas (brown patches) represent water. The white patches represent missing data.
- The NSW DPI continues to closely monitor conditions in this region.
Drought indicators remain stable for inland areas, indicating a positive outlook for production. In contrast, the drought indicators are rapidly declining in parts of the coast and hinterland.
- The Drought History charts (Figure 32) show the individual response of the drought indicators at Bega, Cooma and Goulburn.
- Although still high, there has been a decline in the indicators at Cooma and Goulburn.
- There has been a continued decline in all indicators at Bega. Producers in the Bega region should monitor conditions in line with their production systems.
- To access a Drought History chart for your Parish, visit the Seasonal Conditions Information Portal.
The Combined Drought Indicator (CDI) is a tool that monitors drought conditions across NSW. The drought categories are based on assessing the response of three drought indicators: soil water, plant growth and rainfall. The indicators track the data over the past 12 months and shows how the indices are tracking compared to the long-term averages. The information provided in the map is aggregated to a Parish level and provides a regional assessment of conditions. Variability within and between farms is possible and this may not be reflected in the CDI map.


How does it work?
 framework")
The Combined Drought Indicator is one source of information that informs policy and Government responses to changing seasonal conditions, including drought. The map provides a snapshot of conditions at a point in time and is not used to determine eligibility for drought assistance measures offered by the NSW Government.
Much of the information in the Seasonal Conditions Report is sourced from the NSW DPI Enhanced Drought Information System (EDIS)™. The EDIS system is subject to an intensive ground truthing process. For more information, visit the interactive website via droughthub.nsw.gov.au.
EDIS is an ongoing project aimed at improving the quality and timeliness of efforts to monitor conditions across the state. Key features of the system are:
- It tracks drought by using four indicators; rainfall, soil water, plant growth, as well as tracing rainfall trends. Agronomic conditions have equal value to rainfall recorded at meteorological stations.
- The Combined Drought Indicator (CDI) brings this information together and has been designed to characterise developing drought conditions. The key purpose for building the CDI was as a drought early warning system.
- The rainfall, soil moisture and plant growth indicators in EDIS account for conditions over a 12-month window. This provides a compromise between a highly sensitive indicator (e.g. six months) and a less sensitive indicator (e.g. 24 months).
- Climate and remote sensing data drive the information system at a high resolution, but the CDI is reported at a Parish level.
- Because of its configuration and purpose, there will be differences to the indicator used in the National Drought Monitoring Framework (the Australian Rainfall Deficiency Analyser) which relies on rainfall alone.
- The CDI has three drought categories that characterise NSW according to drought intensity as well as the main drivers of a drought event (meteorological, hydrological and agronomic). DPI considers areas Drought Affected to be experiencing a drought event.
- The Drought Affected category encompasses a wide range of conditions from the very early stages of drought entry through to a drought event becoming intense. This enables the drought monitoring system to detect a drought event early. It is also possible to stay in the Drought Affected category for some period of time.
The way in which the indicators are combined to form the CDI is described in Table 1 below.
Table 1: Description of the Combined Drought Indicator framework
CDI Phase | Technical definition | Description - typical field conditions |
|---|---|---|
Intense Drought | All three indicators (rainfall, soil water, plant growth) are below the 5th percentile | Ground cover is very low, soil moisture stores are exhausted and rainfall has been minimal over the past 6-12 months. |
Drought | At least one indicator is below the 5th percentile | Conditions may be very dry, or agronomic production is tight (low soil moisture or plant growth). It is possible to be in Drought when there has been some modest growth, or a few falls of rain. |
Drought Affected (intensifying) | At least one indicator is below the 30th percentile and the rainfall trend is negative over the past 90 days. | Conditions are deteriorating; production is beginning to get tighter. Ground cover may be modest, but growth is moderate to low for the time of year. When indicators are close to the Drought threshold drought conditions are severe. |
Drought Affected (weakening) | At least one indicator is below the 30th percentile and the rainfall trend is positive over the past 90 days. | Production conditions are getting tighter, but there have been some falls of rain over the past month. It is rare to enter the Recovering phase from the Non-Drought category; Usually there is a quick (1-2 week) transition into Drought Affected or Drought. When indicators are close to the Drought threshold drought conditions are severe. |
Recovering | All indicators are below the 50th percentile but above the 30th percentile | Production is occurring but would be considered ‘below average’. Full production recovery may not have occurred if this area has experienced drought conditions over the past six months. |
Non-drought | At least one indicator is above the 50th percentile. | Production is not limited by climatic conditions. |
The NSW State Seasonal Update is provided each month by the NSW DPI Climate Branch.
Information used in this report was primarily sourced from the Australian National University, Australian Bureau of Meteorology, the US National Oceanic and Atmospheric Administration, the International Research Institute for Climate and Society (Columbia University), Geoscience Australia’s Digital Earth Australia Program, and NSW Department of Primary Industries.
Maps in this document contain data which is © Spatial Services – NSW Department of Finance, Services and Innovation (2023), Panorama Avenue, Bathurst 2795 and data which is © Commonwealth of Australia 2023, Australian Bureau of Meteorology, Melbourne, and © Australian National University. All rights reserved.
The seasonal outlooks presented in this report are obtained from the Australian Bureau of Meteorology and other sources (including World Meteorological Organisation Global Producing Centres). These outlooks are general statements about the likelihood (chance) of (for example) exceeding the median rainfall or minimum or maximum temperatures. Such probability outlooks should not be used as categorical or definitive forecasts but should be regarded as tools to assist in risk management and decision making. Changes in seasonal outlooks may have occurred since this report was released.
All climate and remote sensing input data is supplied to the Enhanced Drought Information System™ under the Australian Creative Commons Licence (CCY 4.0) and is made available by the Terrestrial Ecosystem Research Network.
© State of New South Wales through the Department of Regional NSW, 2023. You may copy, distribute and otherwise freely deal with this publication for any purpose, provided that you attribute the NSW Department of Primary Industries as the owner.
Disclaimer: The information contained in this publication is based on knowledge and understanding at the time of writing (September 2023). However, because of advances in knowledge, users are reminded of the need to ensure that information upon which they rely is up to date and to check currency of the information with the appropriate officer of the Department of Primary Industries or the user’s independent adviser.
Published by the NSW Department of Primary Industries. ISSN 2202-1795 (Online). Volume 11 Issue 8.
