

NSW State Seasonal Update - February 2024
Prepared by NSW DPI
NSW overview
Drought conditions continue to ease for much of NSW
- The NSW DPI Combined Drought Indicator (CDI) shows that 45% of NSW is in one of the three drought categories at the end of February 2024 (Figure 1).
- This is driven by ongoing moderate to low levels of stored soil moisture and short-term rainfall deficits returning across a large area of Central-North Eastern NSW. The north east of the Hunter remains in Intense Drought conditions. Conditions remain dry along the south coast with the Bega region remaining in the Drought category.
- NSW benefited from ex-tropical cyclone Kirrily during February 2024. The southward migration of this system bought storm rainfall to far north western NSW stretching south across central inland NSW.
- Elsewhere short-term rainfall deficits started to emerge with February rainfall below to well below long term averages.
- The continued rainfall has eased drought conditions and areas in the Combined Drought Indicator ‘Recovery’ category have expanded, particularly in western NSW.
- The decision-making environment continues to be challenging for many NSW farmers. Available remote sensing information of pasture conditions highlights that there is considerable variability within and between regions. Farm water supply is also variable across many regions due to hot conditions and variable rainfall throughout February.
- Although there are signs of recovery for some regions, further rainfall is critical in aiding a longer-term drought recovery.
- The Climate outlook issued at the end of February 2024 indicates a high probability of below median rainfall for the March to May forecast period across most of NSW. This is partially due to lower activity in the tropics, with reduced likelihood of low-pressure systems forming and migrating southward over the Autumn period.
- The temperature outlook is for a high probability of above median values.
Seasonal Climate Outlook and Climate Drivers Update – March to May 2024
The outlook is for a high chance of very warm conditions across NSW and a decreased chance of above median rainfall for much of NSW in the March to May period.
- The seasonal rainfall outlook indicates that there is 20% to 55% chance of above median rainfall for most of NSW for the March to May period.
- Temperatures are expected to be well above median across NSW for the outlook period.
- The ENSO Outlook status is at El Niño but weakening, and the Southern Oscillation Index is negative.
- The Indian Ocean Dipole (IOD) value is neutral, and the Bureau of Meteorology suggests the IOD values will remain neutral until at least April.
- Other climate drivers like the Southern Annular Mode (SAM) and local systems continue to bring the prospect of instability in week-to-week weather during this forecast period.
The CDI and its individual rainfall, soil moisture and crop/pasture growth metrics are leading biophysical indices of seasonal conditions and drought status. Other factors affecting production and economic responses usually lag the CDI. Further information about the correct interpretation of the CDI at a region and industry level is provided in the regional breakdown section of this report .
Support Services
Producers and members of rural communities are encouraged to maintain contact with their local professionals who can facilitate access to appropriate support. Local Land Services can provide technical support including animal nutrition and management advice. Visit DroughtHub for support resources including business planning at: droughthub.nsw.gov.au.

It is important to recognise the CDI provides an aggregated view of NSW, and that on-ground conditions can be different to those displayed in the maps. They provide an ‘on average’ view of a particular region only.
Rainfall
Widespread, variable rainfall during February
- Rainfall was variable across NSW during February (Figure 2a) with highly localised storm events for many regions.
- The remnants of ex-tropical cyclone Kirrily brought heaving rainfall and flash flooding to parts of NSW, as the related weather system tracked from the north west of NSW through to the south east.
- Large areas of NSW received between 10 to 200mm of rainfall.
- There was in excess of 200mm in parts of the North Coast region, including rain resulting in minor flooding in some locations on the far North Coast.
Calendar year to date rainfall is average to below average for many areas.
- For the calendar year to date, most of NSW has received between 50mm and 200mm of rainfall.
- The northeast of NSW has generally received the largest rainfall totals.
- A small region in the far northeast and near Coffs Harbour have received greater than 600mm of rainfall since the start of the year.
Short term rainfall deficits emerging in some parts of NSW
- The February rainfall percentile map ranks the total rainfall for February 2024 compared to long term records from 1981-2020 (Figure 2b).
- February rainfall was above the 80th percentile of the historical record for a large area from the far north east stretching across central inland NSW, a result of rainfall from ex-tropical Kirrily. Many areas had falls above the 90th percentile.
- Large parts of the northern, central and southern NSW had lower rain totals in February 2024 relative to long term records, with falls below the 10th to the 40th percentile range. This has slowed the recovery from drought conditions in the north east and Hunter regions.
- Producers continue to monitor conditions and forecasts closely.


Temperature
Higher than average maximum temperatures for most of NSW
- In February, the average maximum temperatures ranged from 18°C in the southern alpine region to above 36°C in the northwest of NSW (Figure 3a).
- Below average maximum temperatures were experience across parts of the South East LLS region.
- Above average maximum temperatures were experienced across most of NSW in February. Maximum temperatures were generally between 0°C and 2°C above average (Figure 3b).
Above average minimum temperatures for large parts of NSW
- Minimum temperatures were generally between 9°C and 24°C for most of NSW. The warmest temperatures (above 24°C) were in the far northwest of the state (Figure 3c).
- Minimum temperature anomalies were generally between 0°C and 2°C above average for most of central, eastern and northern NSW during February (Figure 3d). Cooler than normal anomalies were recorded in parts of western and southern NSW.


Normalised Difference Vegetation Index (NDVI) Anomaly
Plant greenness levels are variable across NSW.
- The seasonal Normalised Difference Vegetation Index anomaly (NDVI) indicates that plant greenness levels are variable across NSW (Figure 4).
- There has been an improvement in plant greenness values over the two months and many areas have above normal plant greenness levels.
- Areas of below average plant greenness have intensified in the South East, north of Bega. The impacts of the December bushfire in the Pilliga between Coonabarabran and Narrabri are also evident in this month’s Update
- Some of the extremely negative NDVI areas (brown patches) are water bodies.

Decision support for drought feeding livestock
NSW Department of Primary Industries’ Drought & Supp Feed Calculator app has been re-released to support NSW livestock producers with their decision making as seasonal conditions change.
The Drought & Supp Feed Calculator simplifies decision making for livestock producers by enabling users to assess pastures and work out feed requirement and if supplementary feeding is needed, compare different supplements and ration mixes, and calculate the costs of different feeding options.
Search for Drought & Supp Feed Calculator and download the application from your app store.
NSW Farm Dam Survey
Water availability is highly variable across NSW
- The NSW Farm Dam Survey indicates that farm dam levels are average to above average across many parts of eastern and southern NSW (Figure 5a).
- Dam levels in the far northwest of NSW have increased since the January Update. This is the result of surface runoff from recent rainfall events including rainfall from the ex-tropical cyclone Kirrily system.
- Large areas of central and western NSW continue to have low dam levels (below 40% capacity).
- The farm dam assessment was not possible for some parts of NSW in February due to missing data.

NSW DPI Farm Tracker Reports
NSW DPI Farm Tracker Application reports are completed by users across NSW. On the ground reports submitted in February show that for those producers that undertook a drought assessment are managing mild or severe drought conditions (Figure 5b).
![]()
Tools for farmers to monitor and report seasonal conditions
The Farm Tracker application is freely available and can be used to help monitor seasonal conditions on your property. Completing a report allows a user to create a geotagged photo diary, monitor dam levels, or record changes at an individual paddock level.
This information provides a detailed and visual record of a farm over time that can be invaluable for budgeting, planning and decision making. The data collected for each farm is not available for other people to see or search.
Reports are also used by NSW DPI as a highly valuable information source to ground truth products from the DPI Seasonal Conditions Monitoring Program. Farmers data remains anonymous in this use.
Search for NSWDPI Farm Tracker and download the application from your app store.
Individual drought indicators
The individual indicators are displayed at a 1km2 gridded resolution. This allows readers to explore the indicator values (percentile scale 0-100) at a much higher level of detail.
The colour scale for each map transitions to a grey scale at the 30th percentile. The 30th percentile is one of the thresholds that DPI uses to monitor drought intensity (the threshold for Drought Affected). The grey scale also shows the 5th percentile used to delineate Drought and Intense Drought.
The Soil Water, Plant Growth and Rainfall indicators are all calculated by taking the aggregate of daily values over the last 12 months and ranking them relative to a 40-year baseline period. This configuration is used to detect moderate to severe drought events with a multiple season duration. The indicators track large changes and are not overtly sensitive to day-to-day or recent conditions over the past month, so lag physical conditions in the field at the time of observation.
Soil Water Index
The Soil Water Index (SWI) is variable across NSW.
- Follow up rainfall over February has aided the continued improvement in the SWI for much of NSW (Figure 6). Southern NSW remains in a strong production position going into autumn.
- A large area of central, north eastern NSW and the south coast have SWI values below the 30th percentile, with some areas below the 10th percentile. This is driven by high summer evaporation and the return of short-term rainfall deficits in February 2024.
- There has been a slight improvement in the SWI over the past few weeks for parts of the North Coast and Northern Tablelands due to recent rainfall events.
- Areas of southern and western NSW continue to have near average to above average root zone SWI values.
- Parts of western NSW also have below average SWI values. Warm daytime and overnight temperatures, along with variable rainfall totals have contributed to this.
- Conditions over the last 6-8 weeks have shifted farm management into an early recovery phase but concern about low sub soil moisture remains.
- This means that there is heightened risk that the recent improvement may not be sustained, further rainfall is critical for longer-term drought recovery.
 to 29 February 2024")
Plant Growth Index
Plant Growth Index values remain stable.
- The Plant Growth Index is above the 50th percentile for most of NSW (Figure 7), with many areas seeing a good pasture response to rainfall over summer.
- Many areas, particularly in southern and western NSW are in a strong production position going into autumn.
- Parts of central, northern, and eastern NSW continue to have below average PGI values where low soil moisture levels are limiting crop and pasture growth rates in dryland production systems.
- Continued follow up rainfall over the coming 6-8 weeks will support continued high production or assist in recovery, as NSW moves into the Autumn pasture growth and winter crop sowing window.
 to 29 February 2024")
Rainfall Index
Rainfall Index values remain variable.
- The Rainfall Index (RI) is variable across the state (Figure 8).
- Significant rain has fallen in parts of NSW over the later part of January and early February 2024. The remnants of ex-tropical cyclone Kirrily has also contributed to recent improvements in the RI, particularly in northern parts of the state.
- Parts of central northern, central, and eastern NSW have RI values below the 30th percentile to below the 5th percentile.
- Southern NSW remains in a strong position going into autumn.
- Continued rainfall through March and April is needed to maintain or improve conditions.
 to 29 February 2024")
Drought Direction Index
Wetting trend for most of NSW.
- The Drought Direction Index (DDI) tracks the 150-day trend of the rainfall index (Figure 9).
- Most of NSW is showing a neutral to weak wetting trend.
- Parts of the South East LLS and far north of NSW are showing a strong wetting trend. This reflects the above average rainfall totals at these locations over the last five months.
- A weak drying trend is evident in parts of western and southern NSW. Shorter term (30-60 day) positive trends in the drought indices are evident at many locations (refer to the Regional Breakdown section for examples).
 to 29 February 2024")
Changes in the individual drought indicators may have occurred since this update was released. For the most current information, please visit DroughtHub.
NSW outlook March to May 2024
(issued 29 February 2024)
Below median rainfall outlook for much of NSW
- The seasonal rainfall outlook indicates that there is a lower-than-normal chance (between 20% to 55%) of above median rainfall for most of NSW for the autumn period (Figure 10).
- Parts of the Hunter and southeast have a near equal likelihood of above or below median rainfall for this outlook period.
- Outlooks based on the Bureau of Meteorology numerical model have moderate to high (50-75%) accuracy for the forecast period.
Warm to hot conditions to continue for much of NSW).
- The maximum temperature outlook indicates a 65% to above 80% chance of exceeding median daytime temperatures across NSW during the forecast period (Figure 11).
- There is a 65% to above 80% chance of warmer than median overnight temperatures across NSW during the forecast period (Figure 12).


Official national outlook
The official national outlook was released by the Bureau of Meteorology on 29 February 2024.
- The rainfall outlook for March to May shows that there is a 60 to 80% chance of below median rainfall for most northern, eastern and the far south-west of Australia. The forecast is neutral for the rest of Australia.
- Maximum temperatures for March to May have a likely to very likely chance (60 to 80%) of being warmer than average for all of Australia.
- Minimum temperatures for the March to May period have a likely to very likely (60% to 80%) chance of being warmer than average for most of Australia.
Global climate drivers
El Niño–Southern Oscillation (ENSO)
- The Bureau of Meteorology’s El Niño-Southern Oscillation (ENSO) Outlook was released on 5 March 2024, with indications that the oceanic indicators are steadily weakening.
- Cloudiness near the equatorial Date Line has decreased over the last fortnight and has returned to the climatological average.
- Climate models indicate sea surface temperatures in the central tropical Pacific are expected to continue declining and are forecast to return to ENSO-neutral in the southern hemisphere autumn 2024.
Southern Oscillation Index (SOI)
- The 30-day Southern Oscillation Index (SOI) for the 30 days 3 March 2024 was -11.0 (Figure 13). The 90-day SOI value is -3.8.
- Sustained negative values of the SOI below −7 typically indicate El Niño while sustained positive values above +7 typically indicate La Niña.

Sea surface temperatures (SST)
- Monthly sea surface temperatures (SST) were warmer than average across the tropical Pacific Ocean (Figure 14). Warm SST anomalies persist along the eastern Australian coastline, from central Queensland south to Tasmania. Warm anomalies also remain in the Tasman Sea. Warm anomalies are also present in parts of the Southern Ocean.
- The latest values of the three NINO indices in the tropical Pacific for the week ending 3 March were: NINO3 +1.28 °C, NINO3.4 +1.23 °C, NINO4 +1.11 °C (sourced from the Bureau of Meteorology on 5 March 2024).
- Persistent NINO3 or NINO3.4 values warmer than +0.8 °C are typical of El Niño, while persistent values cooler than −0.8 °C typically indicate La Niña.
")
Sub-surface sea temperatures
- The four-month sequence of equatorial Pacific sub-surface temperature anomalies (to 29 February 2024) shows weak warm anomalies across most of the equatorial Pacific basin for the top 25m in depth (Figure 15).
- The strength of the warm anomalies has decreased over the last few months. The warm anomalies (of less than 2.00C above average) remain close to the surface. The magnitude and extent of cool anomalies has also increased across the past few months.
- This sub-surface pattern of a layer of warmer than average waters above a layer of cooler than average waters is typical of the declining phase of El Niño.
")
Indian Ocean (Indian Ocean Dipole - IOD)
The Indian Ocean Dipole (IOD) values have weakened and is currently neutral.
- The latest weekly value of the Indian Ocean Dipole (IOD) index to 3 March 2024 was -0.42°C.
- The Bureau of Meteorology advises that the IOD events are typically unable to form between December and April.
- The international climate models surveyed by the Bureau of Meteorology suggest the IOD values will remain neutral until at least April.
Southern Ocean (Southern Annular Mode – SAM)
- The Southern Annular Mode (SAM) index (Figure 16) is currently neutral (as of 5 March 2024). Forecasts indicate the SAM will remain neutral over the coming fortnight. A neutral SAM has little influence on Australian rainfall patterns.
- The Southern Annular Mode (SAM) refers to the north-south shift of rain-bearing westerly winds and weather systems in the Southern Ocean compared to their usual position.
- During summer a positive SAM increases the chance of above average rainfall for parts of eastern NSW. This indicator can be quite volatile and generally influences weather conditions on 1-to-3-week timescales.
 Daily Index and Forecast Summary (Source: Australian Bureau of Meteorology on 6 February 2024)")
CDI status for the regions
The Combined Drought Indicator (CDI) is a tool that monitors drought conditions across NSW. The drought categories are based on assessing the response of three drought indicators: soil water, plant growth and rainfall. The indicators take data over the past 12 months and rank how these conditions sit within the past 40 years of variability. The drought indicators reflect large changes not week to week variability and can lag on-ground conditions.
The information provided in this section provides a regional assessment of conditions (Figure 17). Variability within and between farms is possible and this may not be reflected in the CDI products. The following regional descriptions are based on data available until the end of February 2024.

Murray and Riverina regions
Murray region production outlook remains strong and Riverina region production outlook is improving across the region.
- Rainfall during February has been near to below average when compared to long term averages. However, rainfall over the summer period was well above average for most of the region.
- This has helped maintain conditions across the region as producers plan for winter cropping programs.
- Producers continue to monitor forecasts closely and implement management strategies as required for their enterprises.
- The seasonal NDVI anomaly data (Figure 19) shows that levels of plant greenness are variable across the region.
- There has been an improvement in the plant greenness values since the January update, as pastures respond to summer rainfall events. Most areas continue to experience normal to higher-than-normal plant greenness levels.
- Areas with below average levels of greenness indicate low levels of ground cover and standing dry matter available for livestock.
- Some of the extremely negative NDVI areas (brown patches) represent water.
Drought indicators have responded to rainfall over recent months.
- The Drought History charts show the individual response of the drought indicators for Finley, Hay, Moulamein and Temora (Figure 20).
- At Finley, the indicators have responded well to rainfall over summer.
- At Hay and Temora the indicators have responded at all locations due to recent rainfall over the past months.
- At Moulamein, all indicators are responding well to rainfall events over the summer period.
- To access a Drought History chart for your Parish, visit the Seasonal Conditions Information Portal.

Figure 18. Combined Drought Indicator for the Murray and Riverina regions

Figure 19. NDVI anomaly map for the Murray and Riverina LLS regions

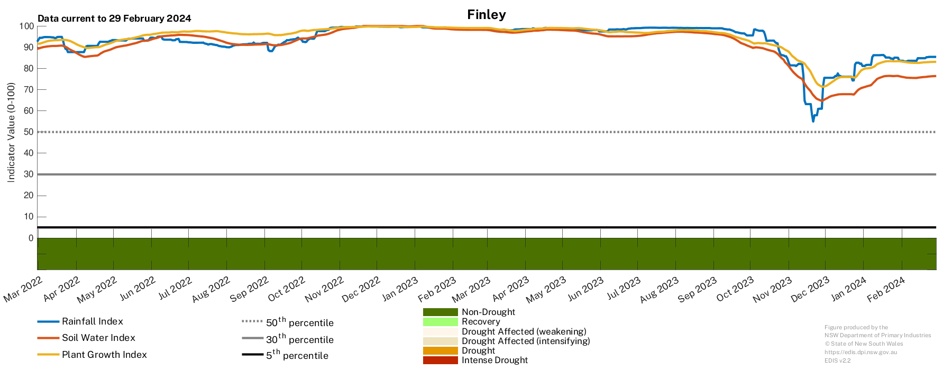
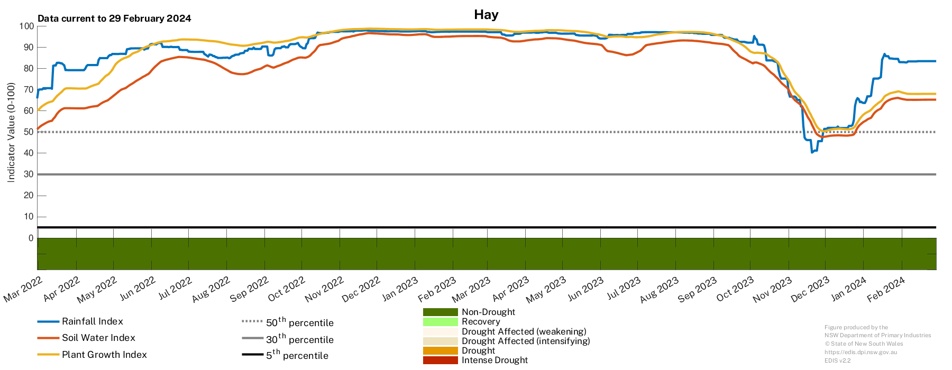
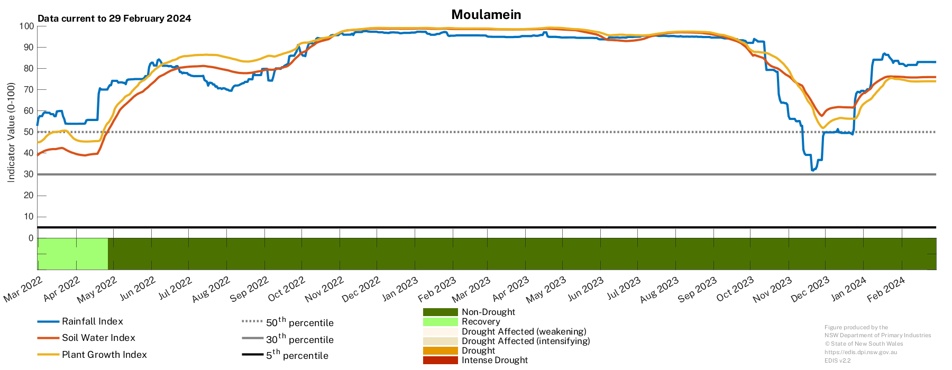
 & Murray (Finley, Moulamein) LLS regions show the current and historical status of the three drought indicators: Rainfall Index, Soil Water Index, and Plant Growth Index")
Western region
Western region producers are monitoring their local seasonal conditions and forecasts closely in line with their production systems..
- The Combined Drought Indicator (CDI) shows approximately 20% of the region in one of the drought categories at the end of February (Figure 21).
- Conditions remain variable across the Western LLS region. Parts of the region have experienced well above average rainfall as a result of localised storm events and the rainfall from ex-tropical cyclone Kirrily. Other parts of the region, particularly in the northeast and southwest rainfall has been below average.
- The area in the Non-Drought and Recovery CDI categories continues to expand. The rainfall that has been received has been effective in maintaining recent improvements in conditions. Further rainfall is critical to aid any recent improvement in conditions across the region.
- It is expected that more of the region will transition into the Recovery category in the coming weeks.
Producers continue to monitor forecasts closely and implement drought management strategies as required for their enterprises. - The NSW DPI continues to closely monitor conditions in this region.
- The seasonal NDVI anomaly data shows that levels of plant greenness were variable across the region (Figure 22).
- There has been an improvement in the plant greenness values since the January update, with pastures and vegetation responding to recent rainfall events.
- Areas with below average levels of greenness indicate low levels of ground cover and standing dry matter available for livestock.
- Some of the extremely negative NDVI areas (brown patches) represent water.
Drought indicators remain variable but have responded to recent rainfall.
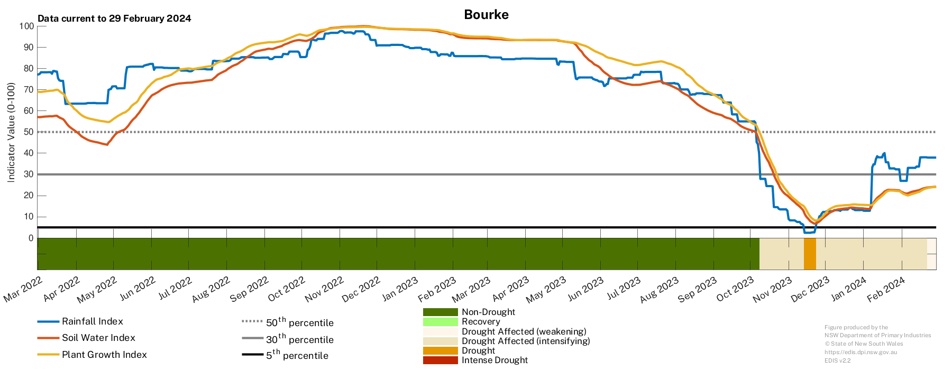
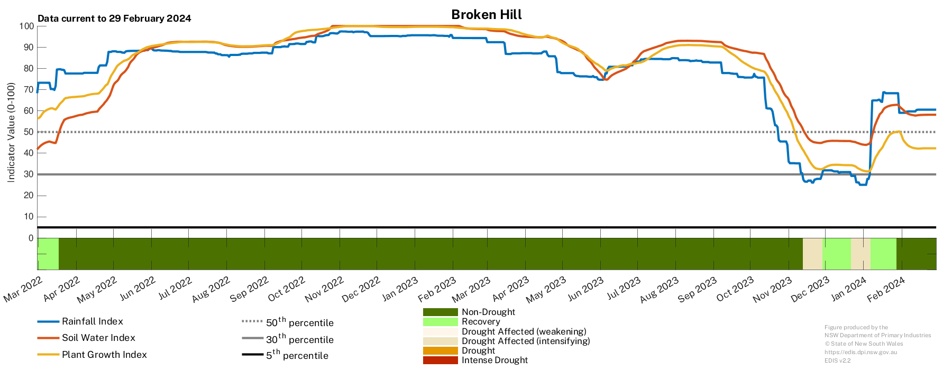
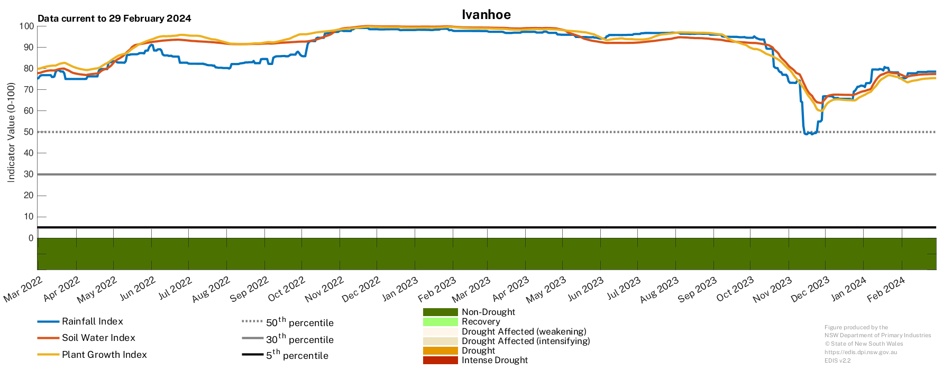
- The Drought History charts show the individual response of the drought indicators for Bourke, Ivanhoe, Wentworth, and Broken Hill (Figure 23).
- The indicators remain strong at Ivanhoe and Wentworth, in response to recent rainfall.
- Bourke remains in the Drought Affected category however the indicators have responded well to recent rainfall over the past month. Follow up rainfall in the coming weeks will be needed to maintain the improvement in conditions.
- The Broken Hill parish has recently transitioned into the Non-Drought category. Follow up rainfall is crucial in ensuring that the region maintains the recent improvements and aid longer term recovery from drought.
- Producers continue to monitor conditions closely in conjunction with forecasts and outlooks.
- To access a Drought History chart for your Parish, visit the Seasonal Conditions Information Portal.

Figure 21. Combined Drought Indicator for the Western LLS region

Figure 22. 3-month NDVI anomaly map for the Western region

North West, Northern Tablelands and North Coast regions
Drought conditions have eased for much of the North Coast and Northern Tablelands regions. Drought conditions continue for most of the North West. Follow up rainfall is needed for aiding long-term recovery.
- For the North Coast and Northern Tablelands, February rainfall was highly variable between farms and across the regions. Generally, there was near average to below average rain for most locations. Pastures have responded well to rain events with good feed available, but soil moisture levels remain low in many areas.
- For the North West, conditions have eased slightly since the January Update, February rainfall was near to below average across the region. Continued follow up rainfall will be critical for a recovery from drought.
- While there has been an easing of the drought conditions in some parts, further rainfall is needed to ensure longer term improvement in conditions.
- Producers continue to monitor forecasts closely and implement drought management strategies as required for their enterprises.
- The seasonal NDVI anomaly data (Figure 25) shows that levels of plant greenness were variable across the regions.
- There has been an improvement in the plant greenness values since the January Update, with pastures responding to rainfall over the past few months. Most areas are experiencing normal to higher-than-normal plant greenness levels.
- Areas with below average levels of greenness indicate low levels of ground cover and standing dry matter available for livestock.
- The impacts of the December bushfire in the Pilliga, south of Narrabri are evident in this month’s Update.
- Some of the extremely negative NDVI areas (brown patches) represent water.
The drought indicators remain low across the regions.
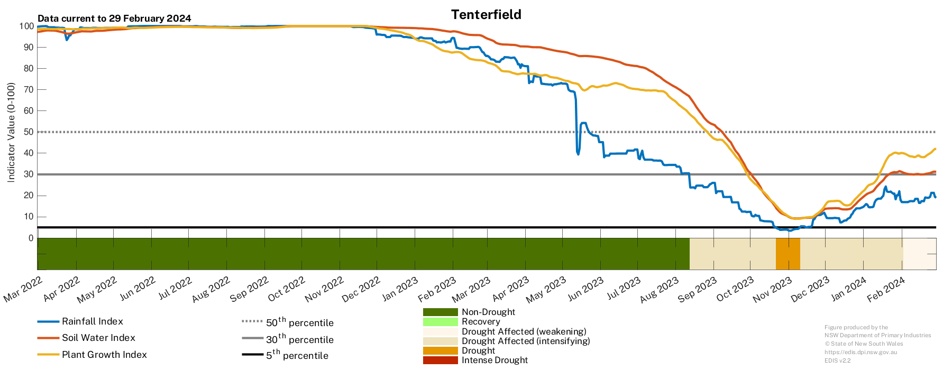
- The Drought History charts (Figure 26) show the individual response of the drought indicators for Lismore, Moree, Tenterfield and Walgett.
- There have been improvements in the indicators at Moree and Walgett, however further substantial rainfall is needed to trigger any recovery from drought conditions across these regions.
- At Tenterfield There has been a positive response in the indicators at all locations due to recent rainfall. Follow up rainfall over the coming weeks will be needed to trigger substantial improvement in conditions.
- At Lismore, the drought indicators have responded well to recent rainfall, however further rainfall is needed to see the region transition into the Recovery category.
- To access a Drought History chart for your Parish, visit the Seasonal Conditions Information Portal.

Figure 24. Combined Drought Indicator for the North West, Northern Tableland and North Coast regions

Figure 25. 3-month NDVI anomaly map for the North West, Northern Tableland and North Coast regions
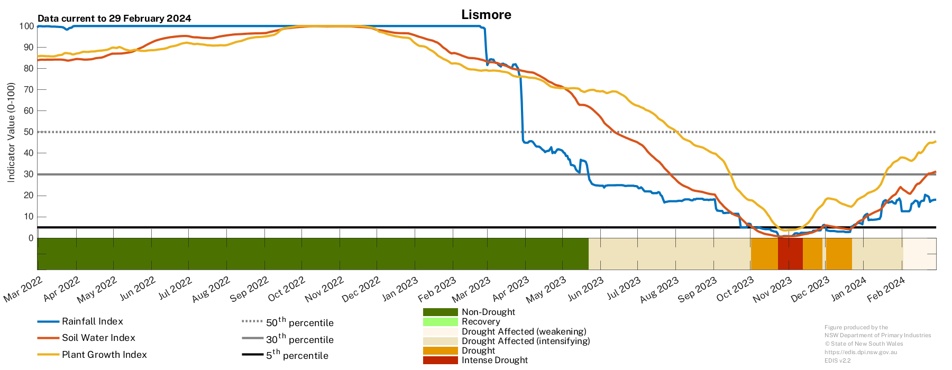
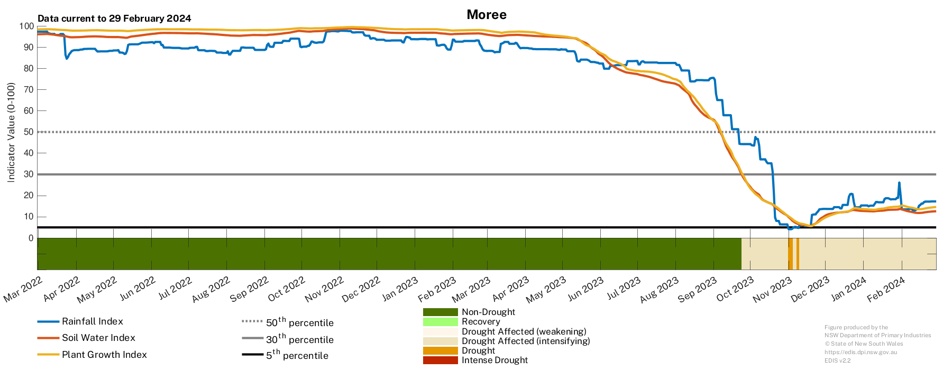
, North West (Moree & Walgett) and North Coast (Lismore) show the current and historical status of the three drought indicators: Rainfall Index, Soil Water Index, and Plant Growth Index")
Central Tablelands, Central West, Hunter and Greater Sydney regions
Drought conditions continue to impact many parts of the Central West, Greater Sydney and Hunter regions, whist conditions ease across parts of the Central Tablelands
- The Combined Drought Indicator (CDI) is variable across the four LLS regions (Figure 27).
- There has been above average rainfall for most of the regions although on-ground reports suggest that this has been highly variable.
- The rainfall has provided much needed soil moisture in the lead up to the winter cropping programs although some regions continue to have low soil water values. Pasture growth remains high for large areas of the regions.
- Below average rainfall during February has seen a continuation of the intensification of drought conditions for the western parts of the Hunter LLS region.
- Continued follow up rain will be needed to aid longer-term improvement in conditions for all regions.
- Producers continue to monitor forecasts closely and implement drought management strategies as required for their farm enterprises, particularly through the remainder of summer and into Autumn.
- The seasonal NDVI anomaly data (Figure 28) shows that levels of plant greenness were variable across the region.
- Plant greenness values have remained generally steady since the January Update. Most areas continue to experience near normal to higher-than-normal plant greenness levels.
- Areas with below average levels of greenness indicate low levels of ground cover and standing dry matter available for livestock.
- Some of the extremely negative NDVI areas (brown patches) represent water.
Drought indicators are variable across the regions and have responded to recent rainfall.
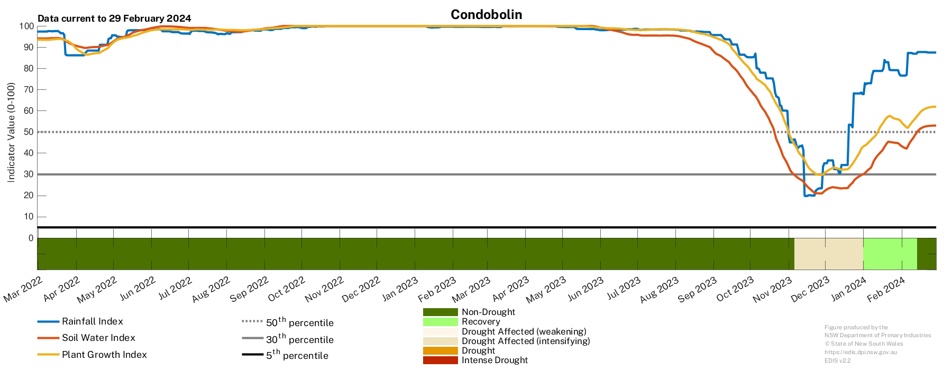
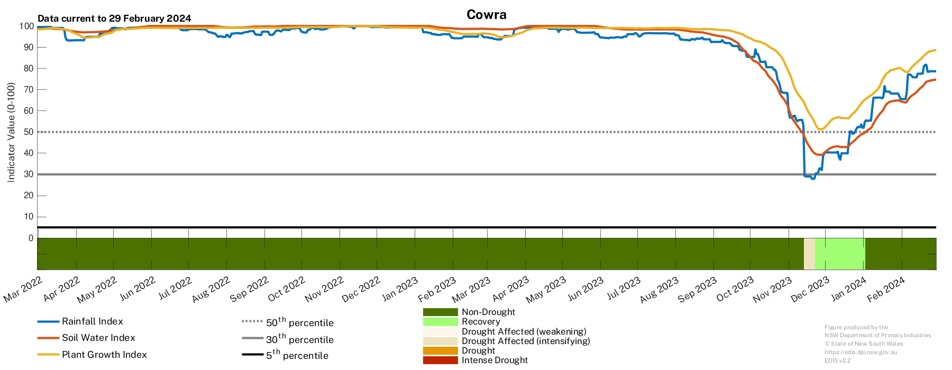
- The Drought History charts (Figure 29) show the individual response of the drought indicators for Cowra, Condobolin and Singleton.
- Condobolin remained in the Recovery category during February. This is in response to good follow up rainfall over the past few months. Further rainfall will continue a longer-term recovery in these areas.
- Cowra remains in the Non-Drought category. The underlying indicators are strong and shows that it is well placed heading into the autumn period.
- At Singleton, conditions remain steady since the January Update. Further rainfall is needed to improve the underlying indicators before any substantial recovery can occur.
- To access a Drought History chart for your Parish, visit the Seasonal Conditions Information Portal.


, Central West (Condobolin), and Hunter (Singleton and Scone) show the current and historical status of the three drought indicators: Rainfall Index, Soil Water Index, and Plant Growth Index")
South East region
Drought conditions continue for parts of the South East region.
- The Combined Drought Indicator (CDI) shows approximately 32% of the region in the one of the drought categories at the end of February (Figure 30).
- Rainfall has aided an improvement in conditions however there is large variability in production conditions across the region. Some regions have responded well to recent rainfall and remain in the Recovery or Non-Drought categories. Further rainfall will aid a longer-term recovery from drought conditions.
- Other regions have not shown a similar response to recent rainfall, particularly in the east of the region. The rainfall has been ineffective in triggering a strong pasture growth response and improving soil moisture levels. The decision-making environment continues to be challenging for many farmers in the region.
- On ground reports suggest that pastures have responded to recent rainfall, although the rainfall has been highly variable. Crop nutrient applications are underway for some regions and preparations have commenced for sowing winter pastures.
- Producers continue to monitor forecasts closely and implement drought management strategies as required for their enterprises.
- The NSW DPI continues to closely monitor conditions in this region.
- The seasonal NDVI anomaly data (Figure 31) shows that levels of plant greenness were variable across the region.
- There has been an improvement in the plant greenness values across most of the region since the January update. Pastures have generally responded well to recent rainfall over the past few months. Most areas are experiencing normal to higher-than-normal plant greenness levels.
- An area around the Bateman’s Bay region between Bodalla and Ulladulla, has had a decline in the plant greenness values since the previous Update. The integrity of the data requires further investigation.
- Some of the extremely negative NDVI areas (brown patches) represent water.
Drought indicators are variable across the region.
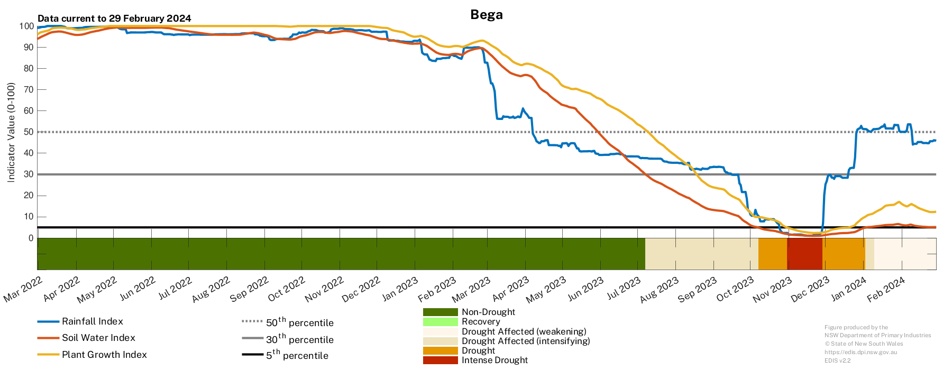
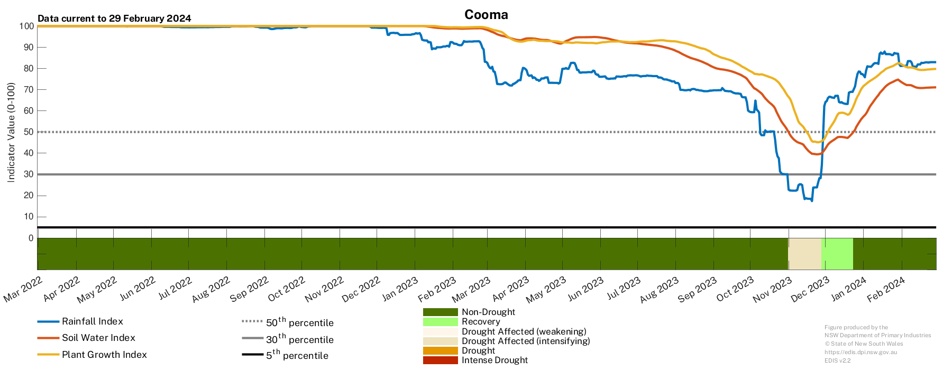
- The Drought History charts show the individual response of the drought indicators at Bega, Cooma and Goulburn (Figure 32).
- The Rainfall Index is strong at Bega, in response to significant rainfall events over the past few months. However, the rainfall has been ineffective in trigging a strong response in the Plant Growth and Soil Water Indices.
- The underlying drought indicators at Cooma and Goulburn have responded well to recent rainfall and further rainfall will aid a longer-term recovery period for these regions.
- To access a Drought History chart for your Parish, visit the Seasonal Conditions Information Portal.

Figure 30. Combined Drought Indicator for the South East region

Figure 31. 3-month NDVI anomaly map for the South East region

How does it work?
The Combined Drought Indicator is one source of information that informs policy and Government responses to changing seasonal conditions, including drought. The map provides a snapshot of conditions at a point in time and is not used to determine eligibility for drought assistance measures offered by the NSW Government.
Much of the information in the Seasonal Conditions Report is sourced from the NSW DPI Enhanced Drought Information System (EDIS)™. The EDIS system is subject to an intensive ground truthing process. For more information, visit the interactive website via droughthub.nsw.gov.au.
EDIS is an ongoing project aimed at improving the quality and timeliness of efforts to monitor conditions across the state. Key features of the system are:
- It tracks drought by using four indicators; rainfall, soil water, plant growth, as well as tracing rainfall trends. Agronomic conditions have equal value to rainfall recorded at meteorological stations.
- The Combined Drought Indicator (CDI) brings this information together and has been designed to characterise developing drought conditions. The key purpose for building the CDI was as a drought early warning system.
- The rainfall, soil moisture and plant growth indicators in EDIS account for conditions over a 12-month window. This provides a compromise between a highly sensitive indicator (e.g. six months) and a less sensitive indicator (e.g. 24 months).
- Climate and remote sensing data drive the information system at a high resolution, but the CDI is reported at a Parish level.
- Because of its configuration and purpose, there will be differences to the indicator used in the National Drought Monitoring Framework (the Australian Rainfall Deficiency Analyser) which relies on rainfall alone.
- The CDI has three drought categories that characterise NSW according to drought intensity as well as the main drivers of a drought event (meteorological, hydrological and agronomic). DPI considers areas Drought Affected to be experiencing a drought event.
- The Drought Affected category encompasses a wide range of conditions from the very early stages of drought entry through to a drought event becoming intense. This enables the drought monitoring system to detect a drought event early. It is also possible to stay in the Drought Affected category for some period of time.
The way in which the indicators are combined to form the CDI is described in Table 1 below.
Table 1: Description of the Combined Drought Indicator framework
CDI Phase | Technical definition | Description - typical field conditions |
|---|---|---|
Non-drought | All indicators greater than the 50th percentile or all indicators are greater than the 30th percentile AND the previous category is Non-drought | Production is not limited by climatic conditions. |
Recovering | All indicators are greater than the 30th percentile AND any indicator is less than the 50th percentile AND the previous category is Drought Affected. | Production is occurring but would be considered ‘below average’. Full production recovery may not have occurred if this area has experienced drought conditions over the past six months. |
Drought Affected (weakening) | Any indicator is less than the 30th percentile AND Positive 5-month Rainfall Index trend (DDI>0.4). | Production conditions are getting tighter, but there have been some falls of rain over the past month. It is rare to enter the Recovering phase from the Non-Drought category; Usually there is a quick (1-2 week) transition into Drought Affected or Drought. When indicators are close to the Drought threshold drought conditions are severe. |
Drought Affected (intensifying) | Any indicator is less than the 30th percentile AND Negative 5-month Rainfall Index trend (DDI≤0.4). | Conditions are deteriorating; production is beginning to get tighter. Ground cover may be modest, but growth is moderate to low for the time of year. When indicators are close to the Drought threshold drought conditions are severe. |
Drought | Any indicator is less than the 5th percentile | Conditions may be very dry, or agronomic production is tight (low soil moisture or plant growth). It is possible to be in Drought when there has been some modest growth, or a few falls of rain. |
Intense Drought | All three indicators (rainfall, soil water, plant growth) are below the 5th percentile | Ground cover is very low, soil moisture stores are exhausted, and rainfall has been minimal over the past 6-12 months. |
The NSW State Seasonal Update is provided each month by the NSW DPI Climate Branch.
Information used in this report was primarily sourced from the Australian National University, Australian Bureau of Meteorology, the US National Oceanic and Atmospheric Administration, the International Research Institute for Climate and Society (Columbia University), Geoscience Australia’s Digital Earth Australia Program, and NSW Department of Primary Industries.
Maps in this document contain data which is © Spatial Services – NSW Department of Finance, Services and Innovation (2024), Panorama Avenue, Bathurst 2795 and data which is © Commonwealth of Australia 2023, Australian Bureau of Meteorology, Melbourne, and © Australian National University. All rights reserved.
The seasonal outlooks presented in this report are obtained from the Australian Bureau of Meteorology and other sources (including World Meteorological Organisation Global Producing Centres). These outlooks are general statements about the likelihood (chance) of (for example) exceeding the median rainfall or minimum or maximum temperatures. Such probability outlooks should not be used as categorical or definitive forecasts but should be regarded as tools to assist in risk management and decision making. Changes in seasonal outlooks may have occurred since this report was released.
All climate and remote sensing input data is supplied to the Enhanced Drought Information System™ under the Australian Creative Commons Licence (CCY 4.0) and is made available by the Terrestrial Ecosystem Research Network.
© State of New South Wales through the Department of Regional NSW, 2024. You may copy, distribute and otherwise freely deal with this publication for any purpose, provided that you attribute the NSW Department of Primary Industries as the owner.
Disclaimer: The information contained in this publication is based on knowledge and understanding at the time of writing (February 2024). However, because of advances in knowledge, users are reminded of the need to ensure that information upon which they rely is up to date and to check currency of the information with the appropriate officer of the Department of Primary Industries or the user’s independent adviser.
Published by the NSW Department of Primary Industries. ISSN 2202-1795 (Online). Volume 12 Issue 2.
