

NSW State Seasonal Update - May 2023
Prepared by NSW DPI
NSW overview
The NSW DPI Combined Drought Indicator (CDI) shows greater than 99% of NSW remains in the Non-Drought category at the end of May. Despite variable rainfall in May, the production outlook continues to remain strong for most areas of NSW. Some regions have experienced drying over the last few months and are managing an autumn feed deficit leading into their normal winter production gap, particularly in north eastern NSW, Hunter and Bega regions.
Current conditions
- May rainfall was variable, concentrated largely in southern, northern-eastern and isolated parts of coastal NSW.
- Dry conditions have impacted parts of the state leading to a rapid decline in plant growth and rainfall indicators in the north, north-east, and south-east. The available on ground reports are that some areas are managing autumn feed deficits. The DPI continues to closely monitor conditions.
- Subsoil moisture levels for NSW are mostly average to above average, generally drier in the north-east, far south-east and north-west of the state.
- Water availability for production remains adequate, with many irrigation schemes at near full capacity.
Seasonal Climate Outlook
- Climate forecasts start to improve in reliability at the end of May, and currently provide a strong indication that rainfall is likely to be below average for all of NSW from June to August.
- There is a high likelihood of warmer than average days for most of NSW for the June to August period.
- Overnight temperatures are likely to be warmer than average for eastern and southern NSW during this period.
- The ENSO Outlook status is at El Niño ALERT, indicating a 70% chance of El Niño forming in winter.
- The Indian Ocean Dipole (IOD) is currently neutral; models suggest a positive IOD event may occur in the coming months. However, the accuracy of IOD forecasts made at this time of year is low.
The CDI and its individual rainfall, soil moisture and crop/pasture growth metrics are leading biophysical indices of seasonal conditions and drought status. Other factors affecting production and economic responses usually lag the CDI. Further information about the correct interpretation of the CDI at a region and industry level is provided in the regional breakdown section of this report .
Support Services
Producers and members of rural communities are encouraged to maintain contact with their local professionals who can facilitate access to appropriate support. If you or someone you know needs support for flood recovery, please see the Natural Disaster Assistance Guide.
Special Disaster Grants – NSW Flooding – August to November 2022 close 30 June 2023.
More support information is also available at: droughthub.nsw.gov.au.

It is important to recognise the CDI provides an aggregated view of NSW, and that on-ground conditions can be different to those displayed in the maps. They provide an ‘on average’ view of a particular region only.
Rainfall
The rainfall anomaly data shows the difference between total monthly rainfall and the long-term average monthly rainfall (1981 – 2010; Figure 2a). Most of NSW has recorded negative rainfall anomalies for May. The highest negative anomalies were recorded around the Port Macquarie region, and west of Coffs Harbour. Positive rainfall anomalies were recorded in parts of the South East Local Land Services (LLS) region and the far north of NSW in the Northern Tablelands LLS region.
Rainfall was variable during May. The highest monthly rainfall totals (above 100mm) were recorded in the southern Alpine regions and the far north coast of NSW (Figure 2b). Large areas of central and Western NSW received less than 5mm of rainfall.
For the calendar year to date most of coastal NSW has received between 200mm to above 400mm of rainfall. Areas around Coffs Harbour, Lismore and to the north and south of Taree have received more than 600mm for this calendar year to date. Rainfall west of the Great Dividing Range is generally between 10mm and 300mm for the calendar year (Figure 2c).


Temperature
Below average maximum temperatures were experienced across NSW in May (Figure 3a). Maximum temperatures were more than 2 degrees below average in part of the Central Tablelands, Riverina and Murray Local Land Services regions. In May the average maximum temperatures ranged from 3°C in the southern alps to above 21°C in north-western NSW (Figure 3b).
Minimum overnight temperatures were below average across NSW in May (Figure 3c). Temperatures were more than 2 degrees below average in southern and parts of eastern NSW. Parts of central and Northern NSW recorded temperatures of more than 4°C cooler than average. The average April minimum temperatures (Figure 3d) ranged between -3°C to 3°C in the alps and Tablelands. The far northwest and east coast of NSW recorded average minimum temperatures of above 6°C.
The alpine and tableland regions experienced a high number of frost days during May (Figure 3e), in contrast to the relatively few frosts experienced in the previous month (April 2023).


Normalised Difference Vegetation Index (NDVI) Anomaly
The seasonal Normalised Difference Vegetation Index (NDVI, Figure 4) indicates that plant greenness levels are variable across NSW. Many areas continue to have above normal plant greenness levels due to recent rainfall aiding plant growth. Near normal to lower than normal levels of plant greenness are present for large areas of the Central West, Hunter, North West and Western Local Land Services areas. Small, isolated patches of lower than average plant greenness is occurring across NSW. Some of the extremely negative NDVI areas (brown patches) are water bodies.

NSW Farm Dam Survey
The NSW Farm Dam Survey indicates dam levels are generally less than 60% of capacity across most of NSW (Figure 5). Regions west of the Great Dividing Range and parts of northern and coastal NSW maintain farm dam levels at less than 40% of capacity. Data is unavailable for some areas of NSW due to cloud cover.

Soil Water Index
The Soil Water Index (SWI, Figure 6) shows conditions continued to decline during May. The areas in the Average SWI category have expanded since the last Update with parts of Western, South East, North West, Hunter Local Land Services regions and north east NSW in this category. A small area west of Grafton has transitioned into the Below Average category. This is due to the low and variable rainfall received over the past few months.
 to 31 May 2023")
Plant Growth Index
The Plant Growth Index (PGI, Figure 7) shows that most of NSW remains in the Extremely High to Above Average PGI category. The Average category has expanded during May with parts of the Western Local Land Services region transitioning into this category.
 to 31 May 2023")
Rainfall Index
The Rainfall Index (RI, Figure 8) shows that at the end of May the area in the Extremely High category has retracted since the last Update. The State remains in the Average to Extremely High category, except for an area to the west of Grafton, south west of Lismore and east of Singleton.
 to 31 May 2023")
Drought Direction Index
The Drought Direction Index (DDI, Figure 9) tracks the 150-day trend of daily rainfall totals. Parts of central and northern NSW have recorded a weak wetting trend. A weak to strong drying trend has been recorded for most of NSW. Areas in the Weak Drying Trend category have experienced a slightly drier April and May compared to previous months. A strong drying trend in the south-east is due to the high rainfall recorded in November and December 2022, and the comparatively drier conditions over the last few months.
Importantly the weak to strong drying trend on its own does not indicate the emergence of a drought in the regions, rather it indicates a degree of drying following on from the previous very wet conditions.
 to 31 May 2023")
Changes in the individual drought indicators may have occurred since this update was released. For the most current information, please visit DroughtHub.
NSW outlook - April to June
(issued 1 June 2023)
High chance of below average rainfall for all of NSW
- There is a 65% to greater than 80% chance of below median rainfall west of the Great Dividing Range between June and August.
- For areas east of the ranges, there is a 50 to 65% chance of receiving below median rainfall over the 3-month period (Figure 10).
High chance of warmer days for NSW
- The maximum temperature outlook indicates a more than 80% chance of exceeding median daytime temperatures across all of NSW (Figure 11).
Moderate to high change of warmer nights in the east and south, cooler in the west
- There is a 55% to above 80% chance of warmer than median overnight temperatures in eastern and southern NSW during the June to August period (Figure 12).
- Across central and western NSW there is a 50% to less than 25% chance of above median overnight temperatures.


Official national outlook
The official national outlook was released by The Bureau of Meteorology on 1 June 2023. The rainfall outlook for June to August shows that most of Australia has a likely to very likely (60 to more than 80%) chance of below median rainfall. There is an equal chance of above or below median rainfall for western Tasmania. Parts of far northern Queensland have a 55 to above 75% chance of above average rainfall.
Maximum temperatures from June to August have a likely to very likely (60 to more than 80%) chance of being warmer than average for most of Australia.
Above median minimum temperatures are likely to very likely (60 to more than 80% chance) for most of Australia for the 3-month period between June to August. Southern parts of the Northern Territory and Queensland, western New South Wales and eastern South Australia have a 60% to 80% chance of below median minimum temperatures.
Forecast accuracy at this time of year has generally been moderate to high for most of Australia. The Bureau issues a new 3-month seasonal update weekly, each Thursday afternoon.
Global climate drivers
El Niño–Southern Oscillation (ENSO)
The Bureau of Meteorology’s El Niño-Southern Oscillation (ENSO) Outlook was released on 6 June 2023. The ENSO Outlook status has been changed to El Niño ALERT. Central and eastern Pacific Ocean Sea surface temperatures (SST) have warmer to El Niño thresholds.
Most international climate models suggest further warming of the central and eastern Pacific Ocean is likely and will remain above El Niño thresholds into Spring. Some atmospheric indicators (e.g., SOI) have shifted towards El Niño thresholds.
The Bureau of Meteorology’s El Niño ALERT indicates a 70% chance of El Niño occurring in 2023.
Southern Oscillation Index
The 30-day Southern Oscillation Index (SOI; Figure 13) for the 30 days ending 4 June was -20.5. The 90-day SOI value was -7.1. Both the 30-day and 90-day continue to show a gradual declining trend. Sustained negative values of the SOI below −7 typically indicate El Niño while sustained positive values above +7 typically indicate La Niña.

Sea surface temperatures (SST)
Monthly sea surface temperatures (SST) were warmer than average across the eastern and western tropical Pacific Ocean (Figure 14). Warm SST anomalies persist in the southern Tasman Sea, from south-east Australia to around New Zealand.
The latest values of the three NINO indices in the tropical Pacific for the week ending 4 June were: NINO3 +1.2 °C, NINO3.4 +0.8 °C, NINO4 +0.6 °C.
Persistent NINO3 or NINO3.4 values warmer than +0.8 °C are typical of El Niño, while persistent values cooler than −0.8 °C typically indicate La Niña.
")
Sea sub-surface temperatures
The four-month sequence of equatorial Pacific sub-surface temperature anomalies (to 31 May 2023) shows warm anomalies are present for most of the top 175m of the equatorial Pacific basin (Figure 15). These warm anomalies are more than 2oC above average for most of the region. Cool anomalies have decreased over the past several months, with none present at the end of May.
")
Indian Ocean (IOD)
The Indian Ocean Dipole (IOD) is currently neutral. The latest weekly value of the Indian Ocean Dipole (IOD) index to 04 June 2023 was +0.32°C.
All of the international climate models surveyed by the Bureau of Meteorology suggest a positive IOD may emerge in the coming months. However, IOD forecasts made at this time of year have low accuracy and outlooks beyond June should be viewed with caution. A positive IOD occurs at values greater than +0.4 °C and can suppress winter and spring rainfall over much of Australia, including NSW.
Southern Ocean (Southern Annular Mode – SAM)
The Southern Annular Mode (SAM) index neutral (as of 6 June; Figure 16).
The Southern Annular Mode (SAM) refers to the north-south shift of rain-bearing westerly winds and weather systems in the Southern Ocean compared to their usual position. This indicator can be quite volatile and generally influences weather conditions on 1 to 3 week timescales.
During autumn SAM typically has a weaker influence on Australian rainfall, but in winter, positive SAM often has a drying influence for parts of south-west and south-east Australia.
 Daily Index and Forecast Summary as of 30 May 2023 (Source: Australian Bureau of Meteorology on 4 June 2023)")
CDI status for the regions
Figure 17 displays the CDI status for each individual Local Land Services (LLS) region to 31 May 2023. The following regional descriptions are based on data available until the end of May 2023.

Murray and Riverina regions
The Combined Drought Indicator (CDI, Figure 18) shows that the Riverina and Murray Local Land Services (LLS) regions remain in the Non-Drought category at the end of May. May rainfall was below average for most of the region and some areas in the central and west have low farm dam levels. Areas in the east are generally experiencing high to very high farm dam levels.
The seasonal NDVI anomaly data (Figure 19) shows that most of the Murray and Riverina regions are experiencing normal to higher than normal plant greenness levels for the March to May period. Some of the extremely negative NDVI areas (brown patches) represent water.
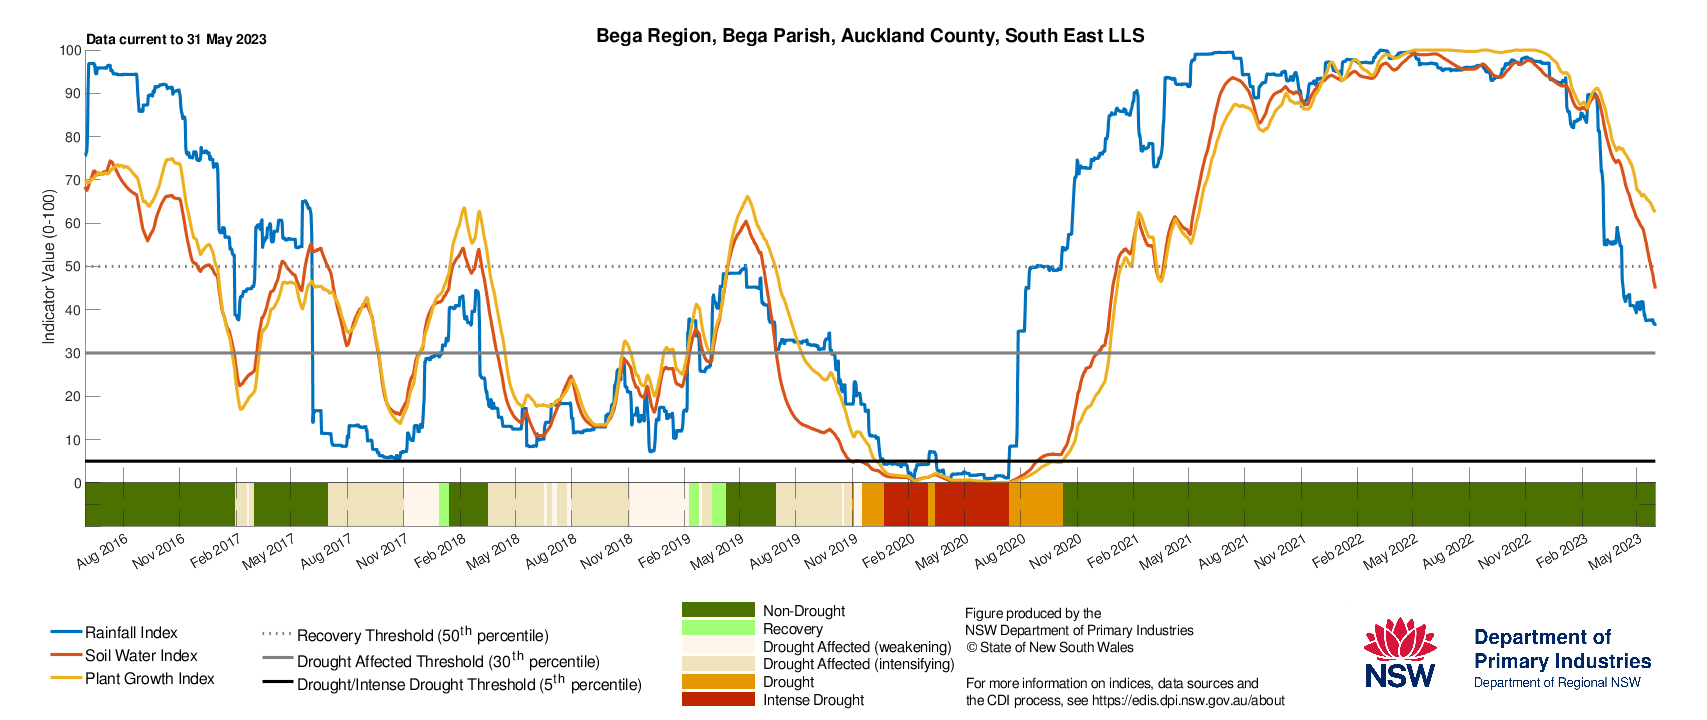
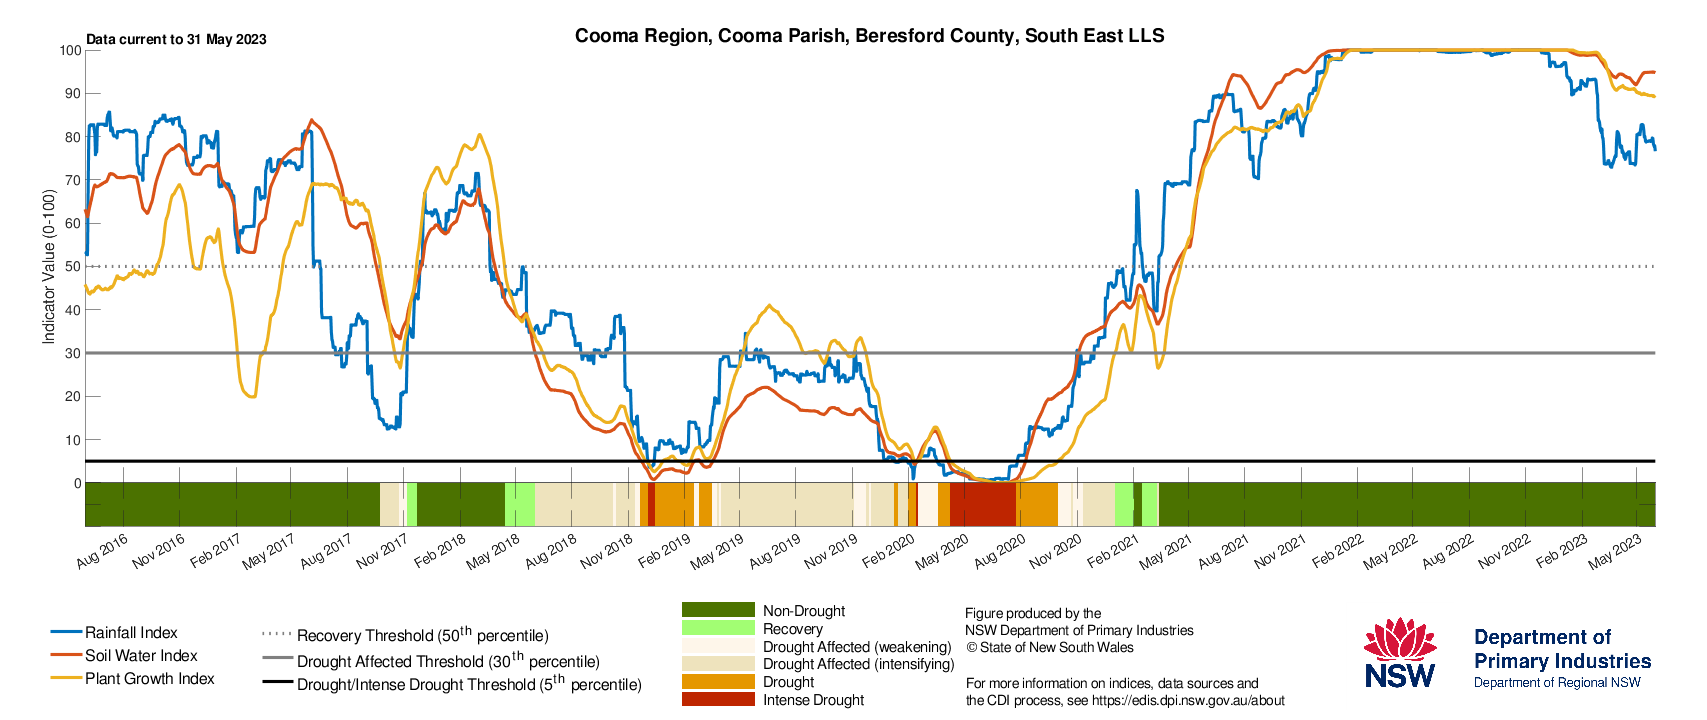
The Drought History charts (Figure 20) show the individual response of the drought indicators for Hay, Temora, Finley, and Moulamein. The indicators are high at all locations and suggest a strong production outlook. To access a Drought History chart for your Parish, visit the Seasonal Conditions Information Portal.
The Combined Drought Indicator (CDI) is a tool that monitors drought conditions across NSW. The drought categories are based on assessing the response of three drought indicators: soil water, plant growth and rainfall. The indicators track the data over the past 12 months and show how the indices are tracking compared to long-term averages. The information provided in the map is aggregated to a Parish level and provides a regional assessment of conditions. Variability within and between farms is possible and this may not be reflected in the CDI map.


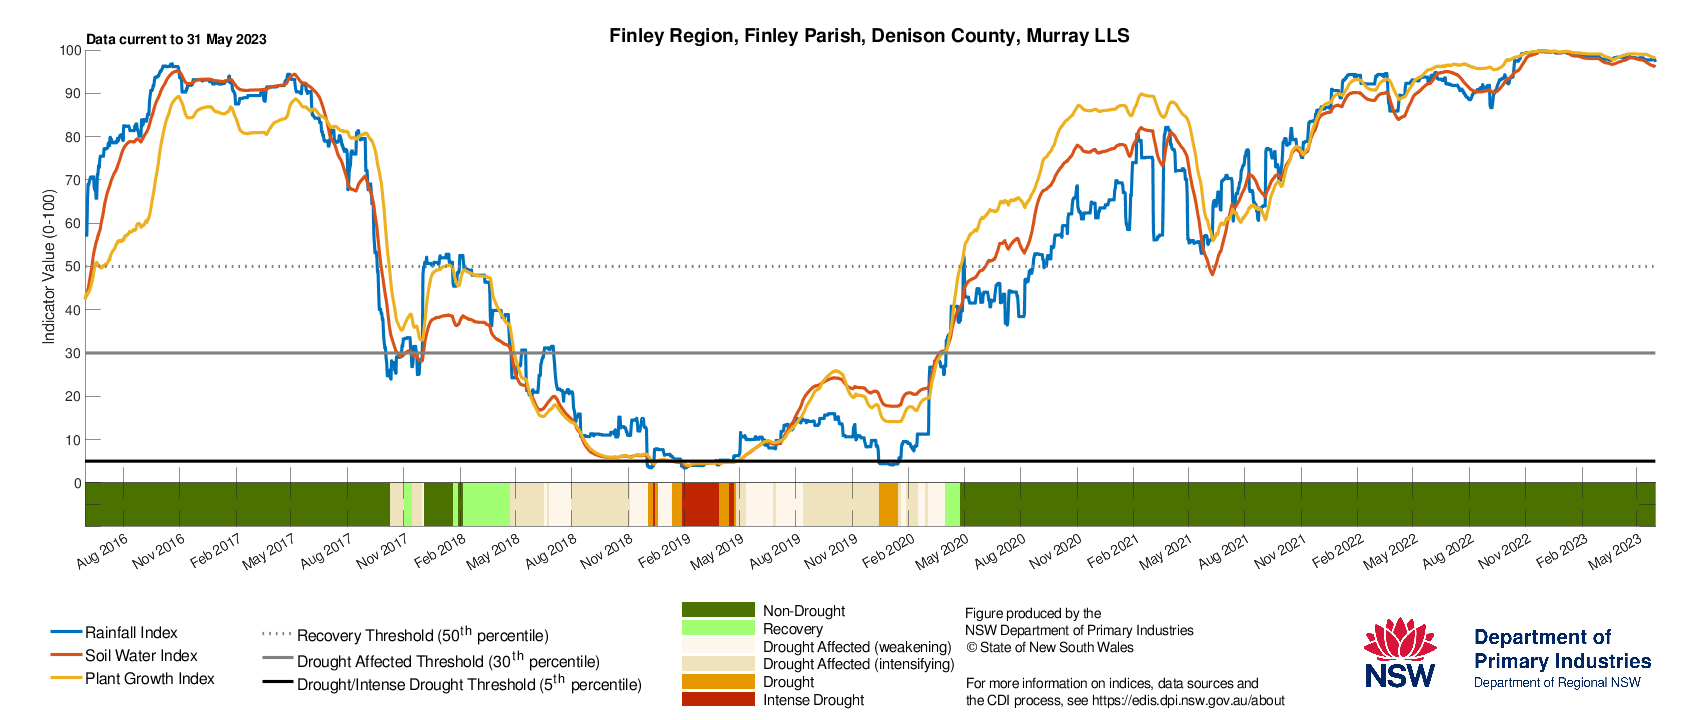
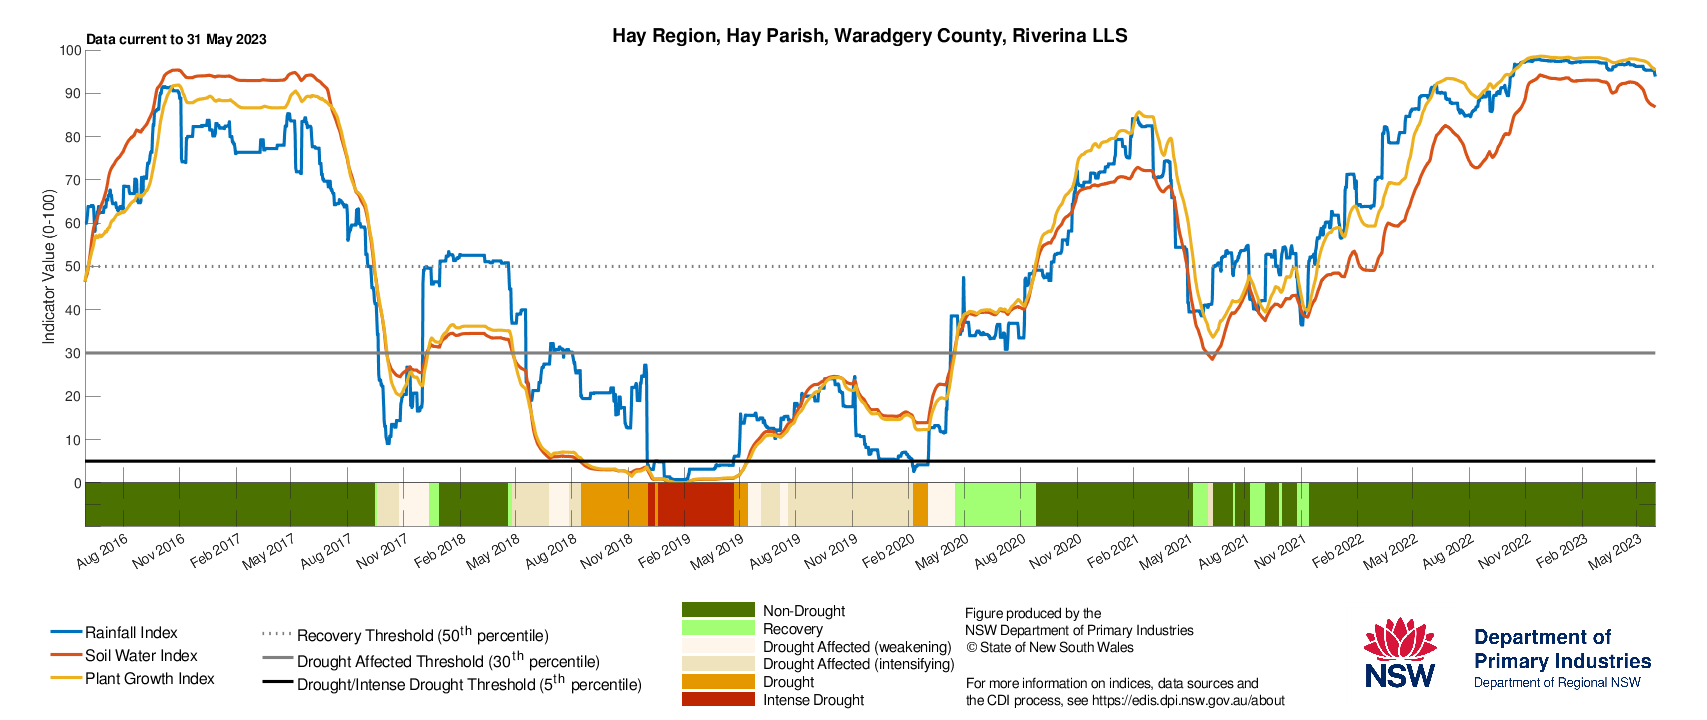
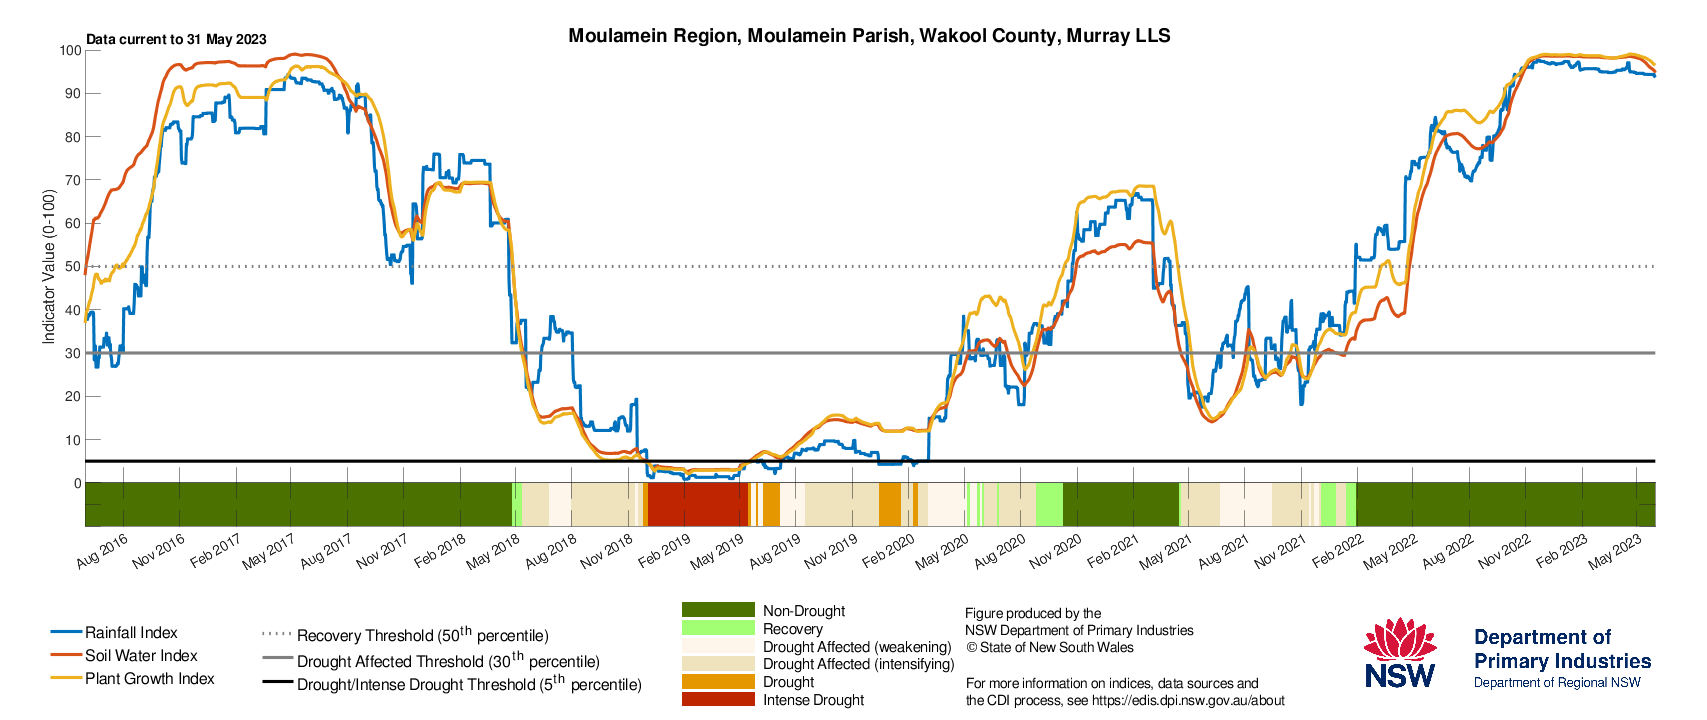
 & Murray (Finley, Moulamein) LLS regions show the current and historical status of the three drought indicators: Rainfall Index, Soil Water Index, and Plant Growth Index")
Western region
The Combined Drought Indicator (CDI, Figure 21) shows that the Western LLS region is currently in the Non-Drought category. May rainfall was below average for the Western region and on-ground conditions are highly variable. For example, some areas have low farm dam levels while other areas are experiencing high to very high farm dam levels due to flooding in 2022. The DPI continues to closely monitor conditions in Western LLS.
The seasonal NDVI anomaly data (Figure 22) shows normal to very high levels of plant greenness across most of the Western LLS region for the March to May period. Lower levels of greenness are apparent in the far north-west and northern areas. Some of the extremely negative NDVI areas (brown patches) represent water.
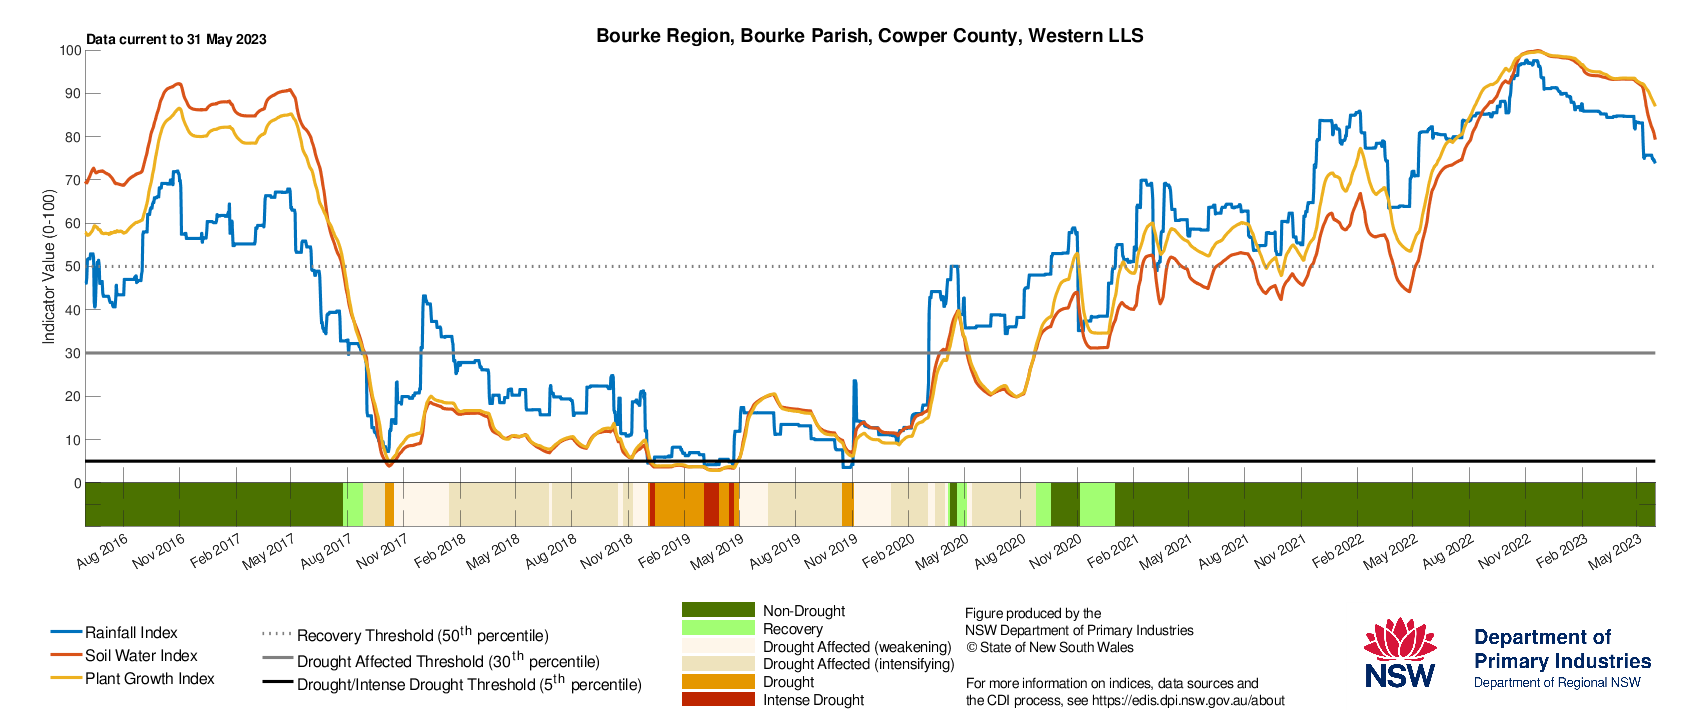
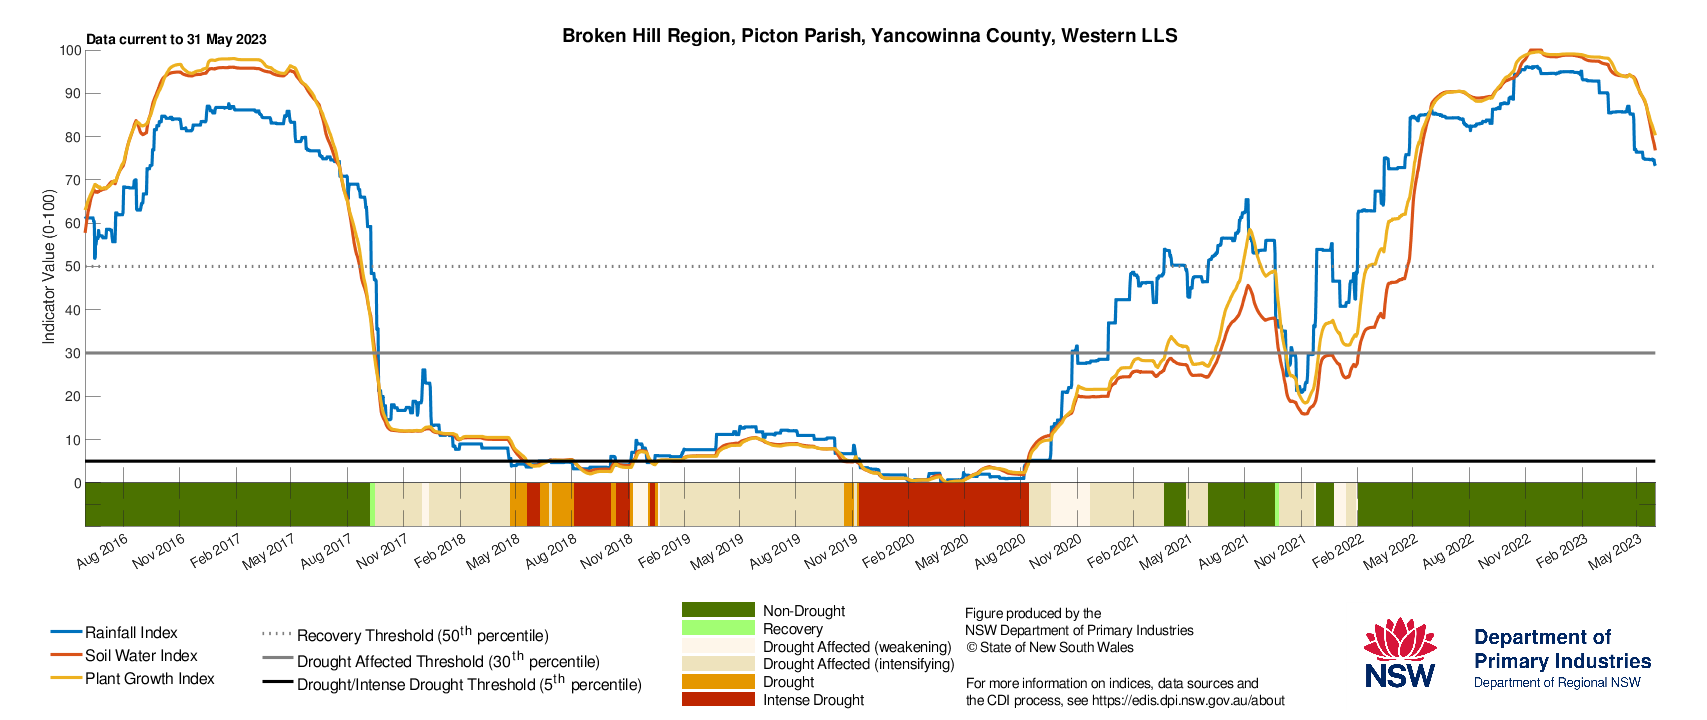
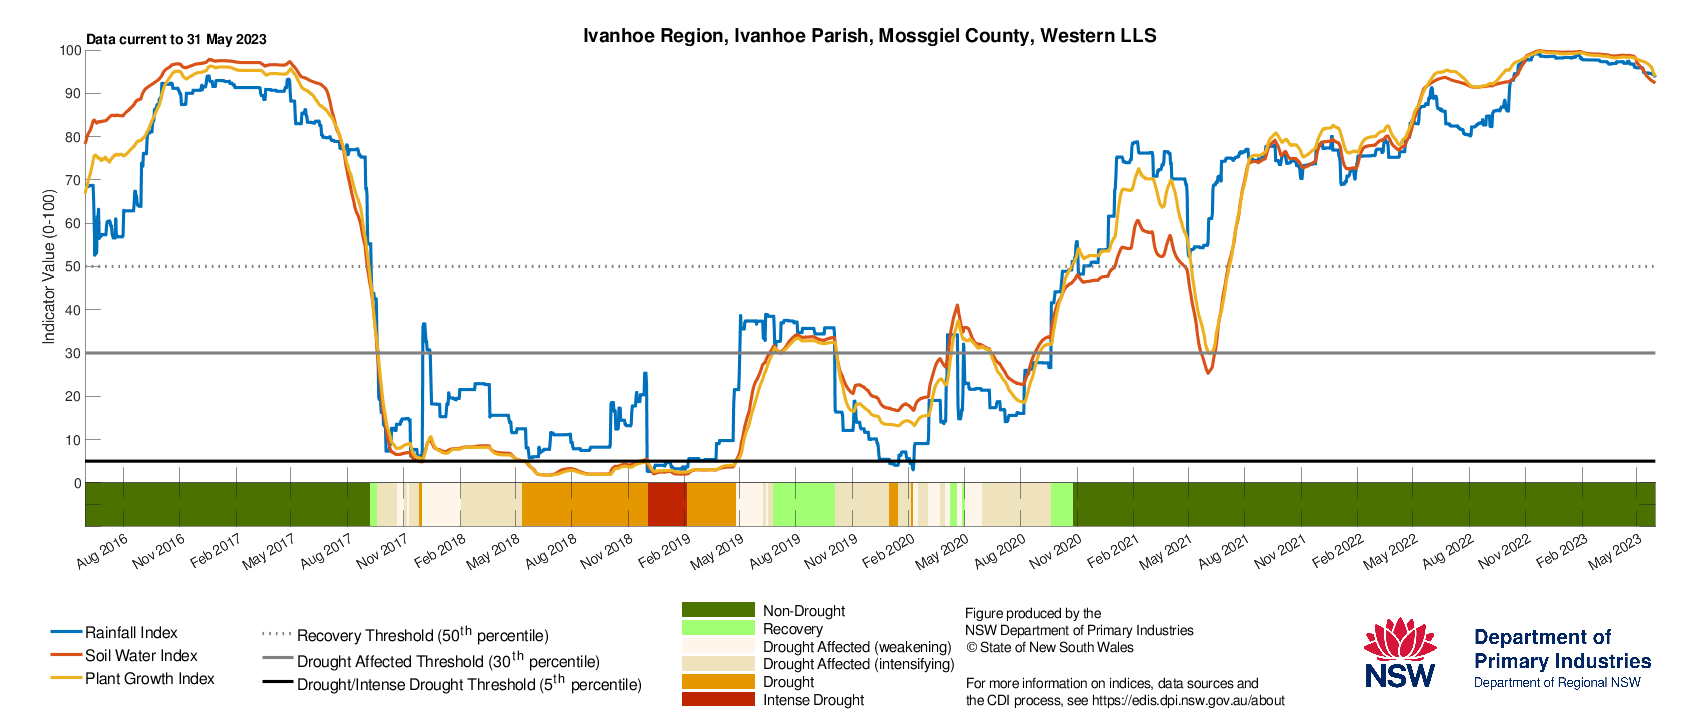
The Drought History charts (Figure 23) show the individual response of the drought indicators for Bourke, Ivanhoe, Wentworth, and Broken Hill. Although still high, the rainfall indicator has declined at Bourke and Broken Hill, with smaller declines also visible in the soil water and plant growth indicators. Indicators remain high at Ivanhoe and Wentworth. To access a Drought History chart for your Parish, visit the Seasonal Conditions Information Portal.
The Combined Drought Indicator (CDI) is a tool that monitors drought conditions across NSW. The drought categories are based on assessing the response of three drought indicators: soil water, plant growth and rainfall. The indicators track the data over the past 12 months. This shows how the indices are tracking compared to the long-term averages. The information provided in the map is aggregated to a Parish level and provides a regional assessment of conditions. Variability within and between farms is possible and this may not be reflected in the CDI map.


North West, Northern Tablelands and North Coast regions
The Combined Drought Indicator (CDI, Figure 24) shows most of these regions are in the Non-Drought category at the end of May. There are areas around Grafton, Lismore, Tweed Heads and Narrabri that transitioned into the Drought Affected category during May 2023. May rainfall was generally below average for the three Local Land Services regions and farm dam water levels are variable.
The seasonal NDVI anomaly data (Figure 25) indicates that parts of the region have average to below average levels of plant greenness. On ground reports indicate that some regions are managing feed deficits and a reduction in stored soil moisture. Some of the extremely negative NDVI areas (brown patches) represent water. The NSW DPI continues to closely monitor conditions in these regions.
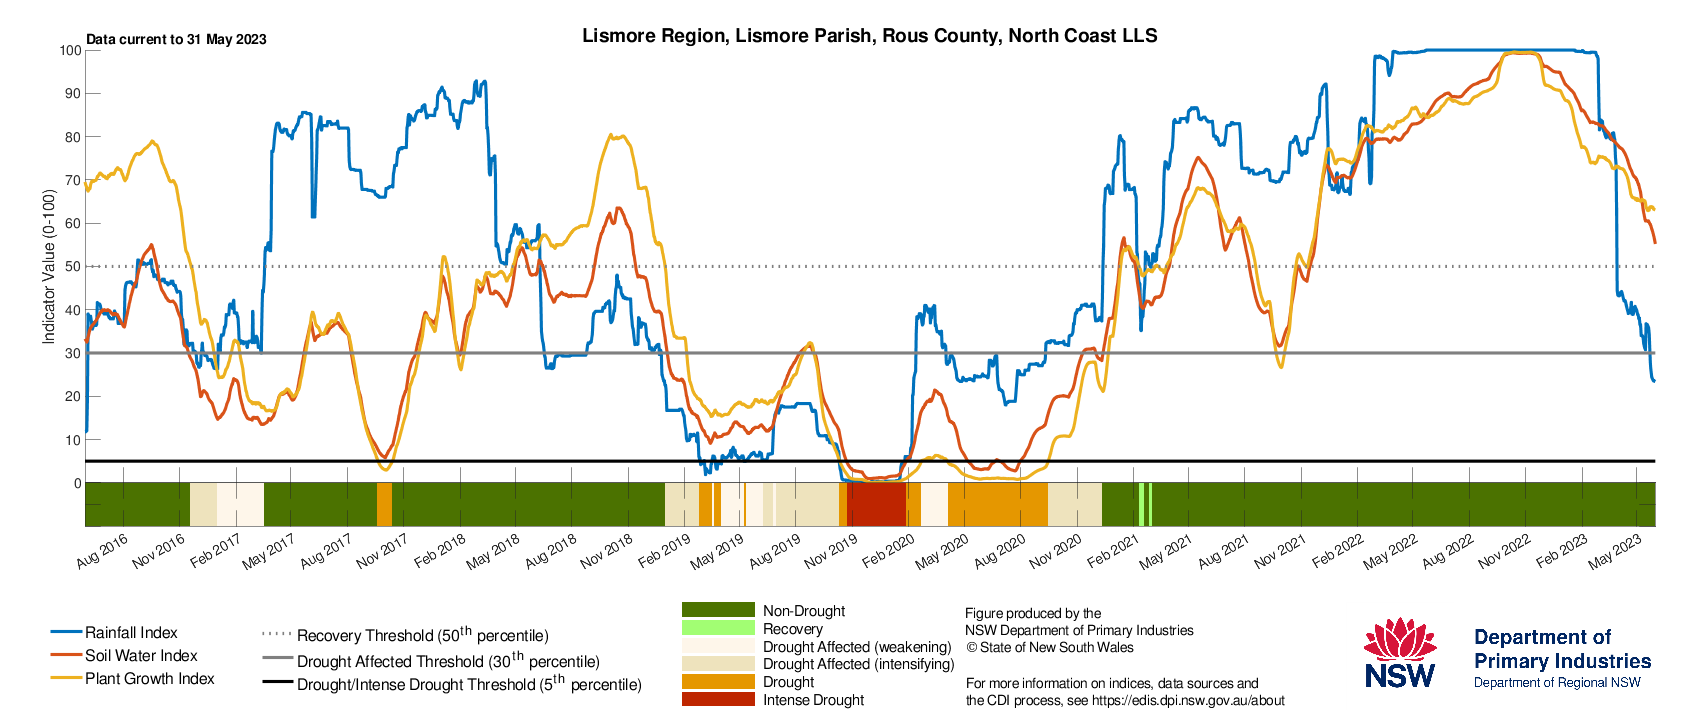
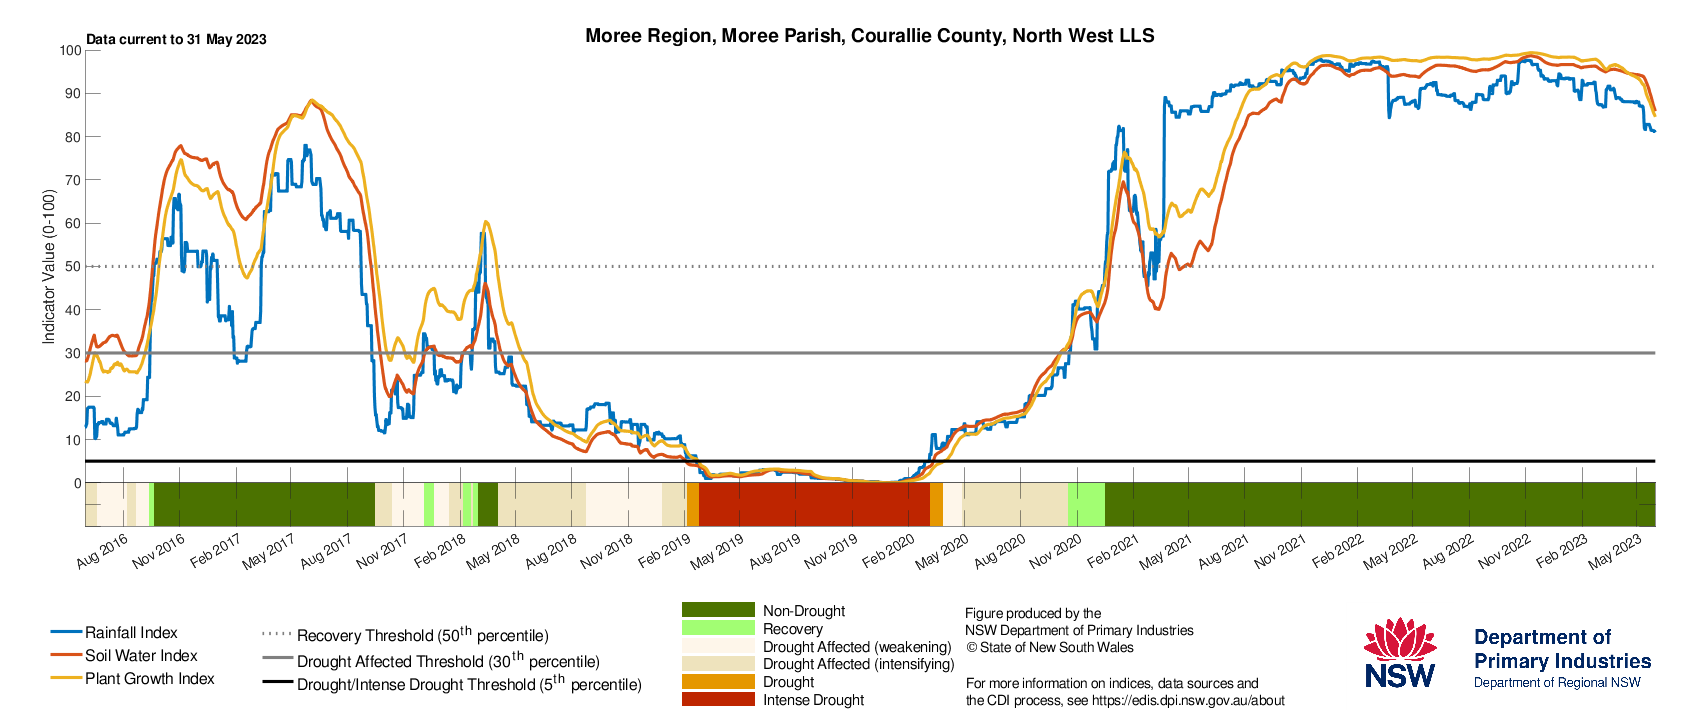
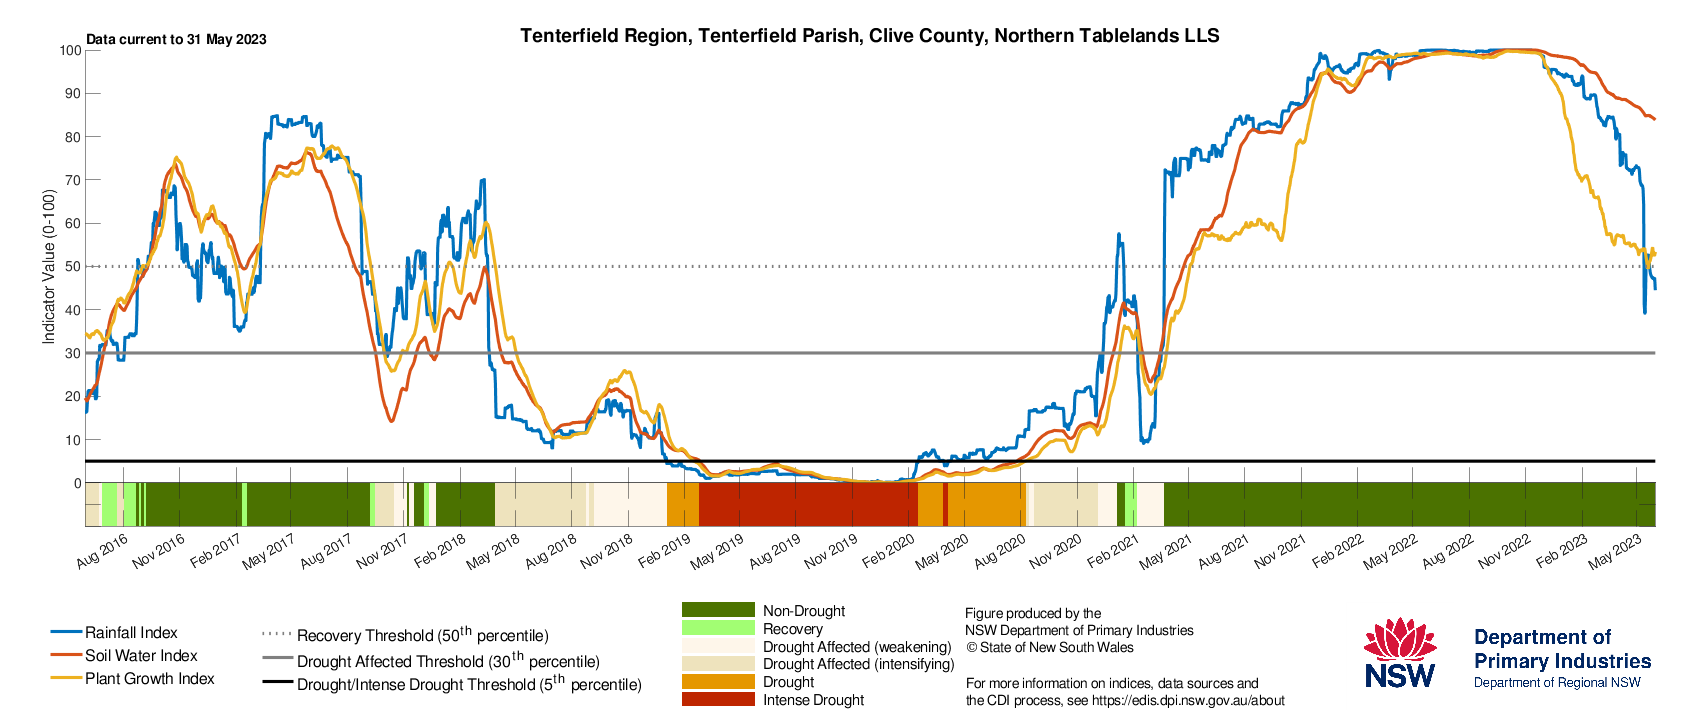
The Drought History charts (Figure 26) show the individual response of the drought indicators for Tenterfield, Moree, Walgett, and Lismore. All indicators remain high at Moree. Indicators have declined further at Tenterfield, Lismore, and Walgett. These sharp declines in the drought indicators are due to below average rainfall and poor pasture production conditions since January 2023. The drought indicators describe conditions over the past twelve months, so these steep declines indicate the recent drying event has been intense. Informal consultation in these regions and media reports indicate some farms are organising stock sales and/or supplementary feeding. Further rainfall is required to maintain production conditions. These regions should continue to monitor conditions closely. To access a Drought History chart for your Parish, visit the Seasonal Conditions Information Portal.
The Combined Drought Indicator (CDI) is a tool that monitors drought conditions across NSW. The drought categories are based on assessing the response of three drought indicators: soil water, plant growth and rainfall. The indicators track the data over the past 12 months and shows how the indices are tracking compared to the long-term averages. The information provided in the map is aggregated to a Parish level and provides a regional assessment of conditions. Variability within and between farms is possible and this may not be reflected in the CDI map.


, North West (Moree & Walgett) and North Coast (Lismore) show the current and historical status of the three drought indicators: Rainfall Index, Soil Water Index, and Plant Growth Index")
Central Tablelands, Central West, Hunter and Greater Sydney regions
The Combined Drought Indicator (CDI; Figure 27) shows that the Central West, Central Tablelands, Hunter and Greater Sydney Local Land Services (LLS) regions continue to experience Non-Drought conditions at the end of May. May rainfall was below average for the four Local Land Services regions and farm dam water levels are variable.
The seasonal NDVI anomaly data (Figure 25) indicates near normal levels of greenness across most of the regions for the March to May period. Parts of the Central West around Coonamble, and the north-west of the Hunter LLS region have below average levels of greenness. On ground reports indicate that some regions are managing feed deficits and a reduction in stored soil moisture. Some of the extremely negative NDVI areas (brown patches) represent water. The NSW DPI continues to closely monitor conditions in these regions.
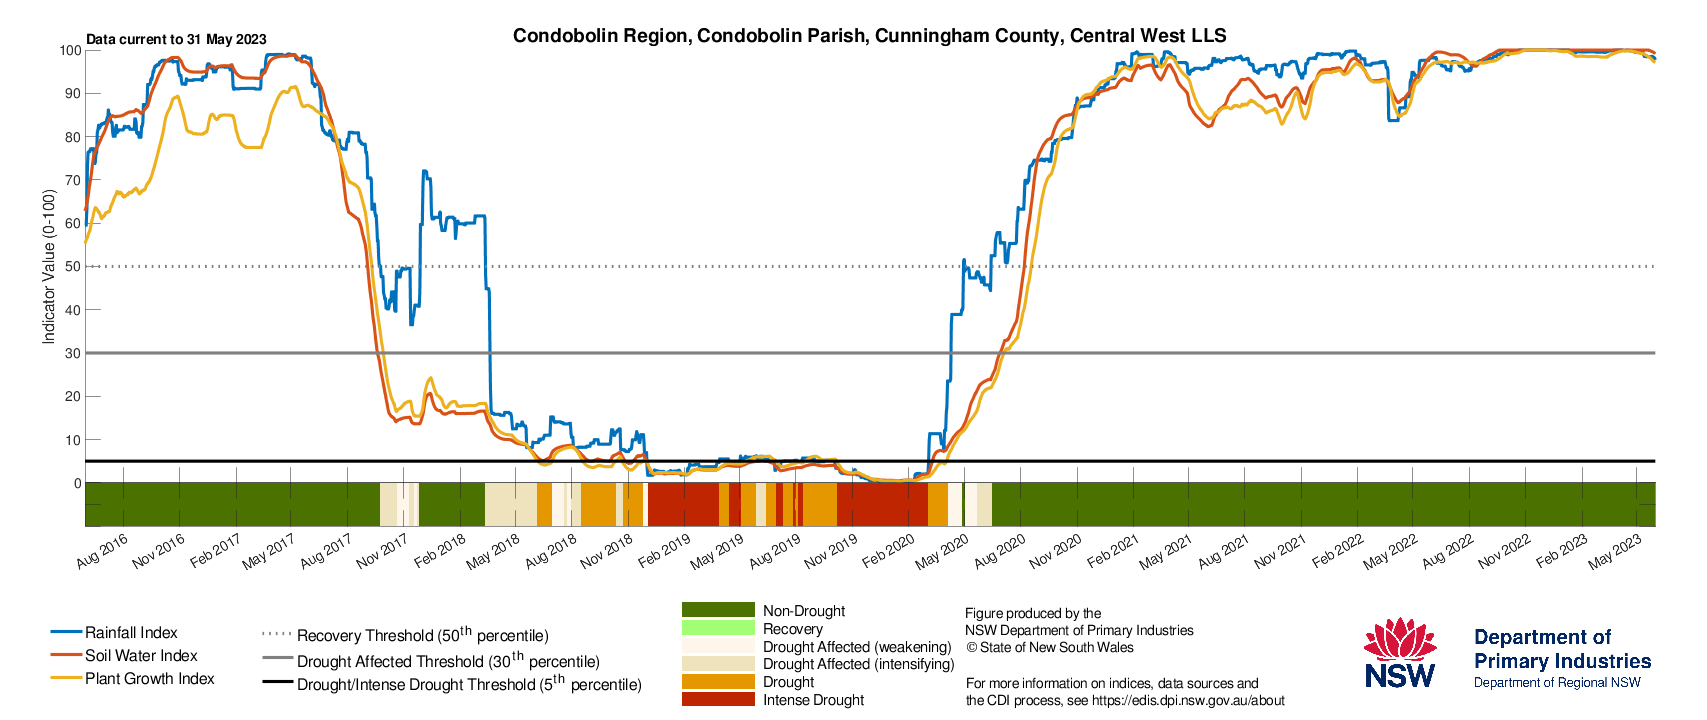
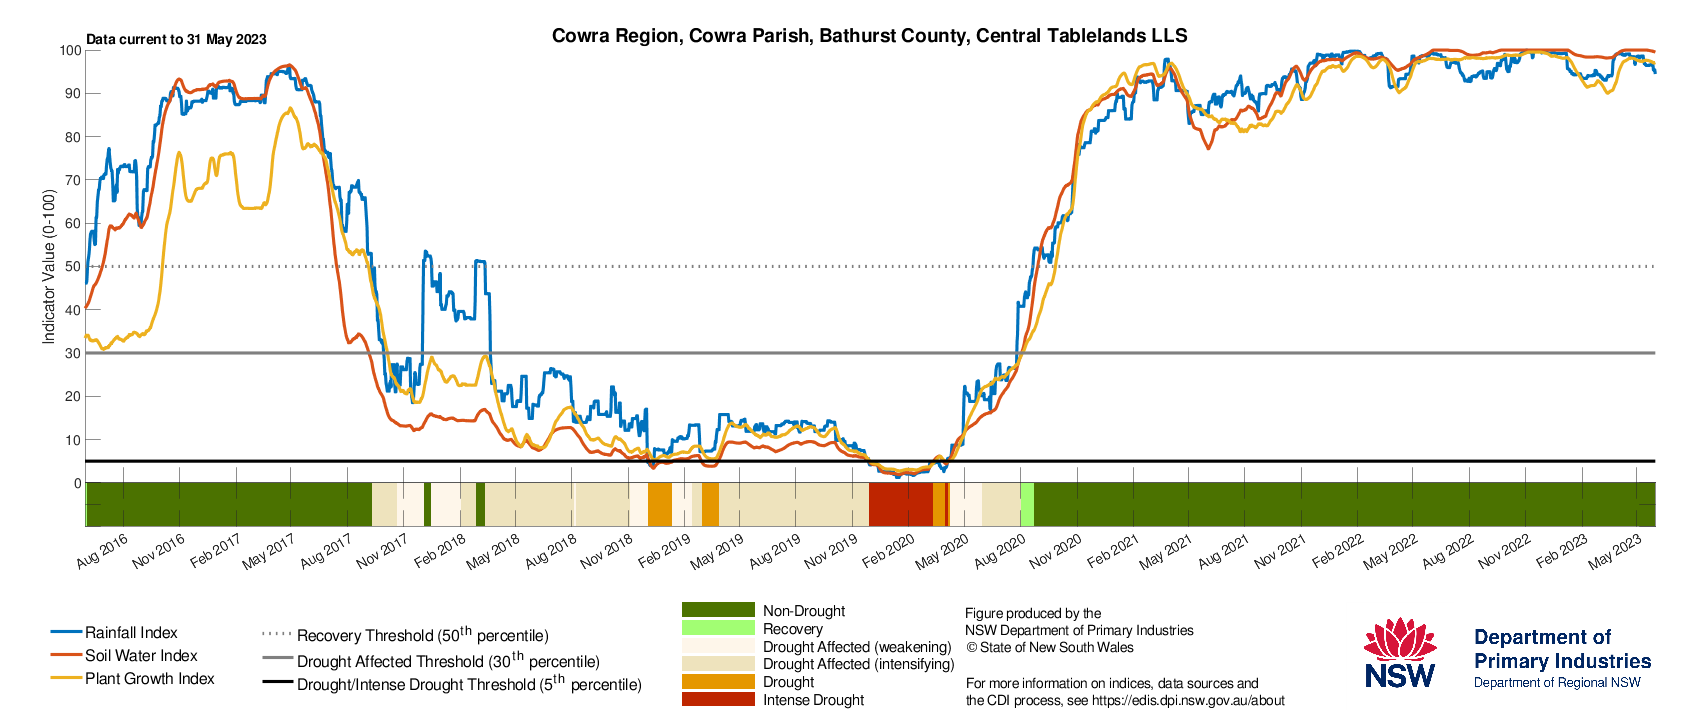
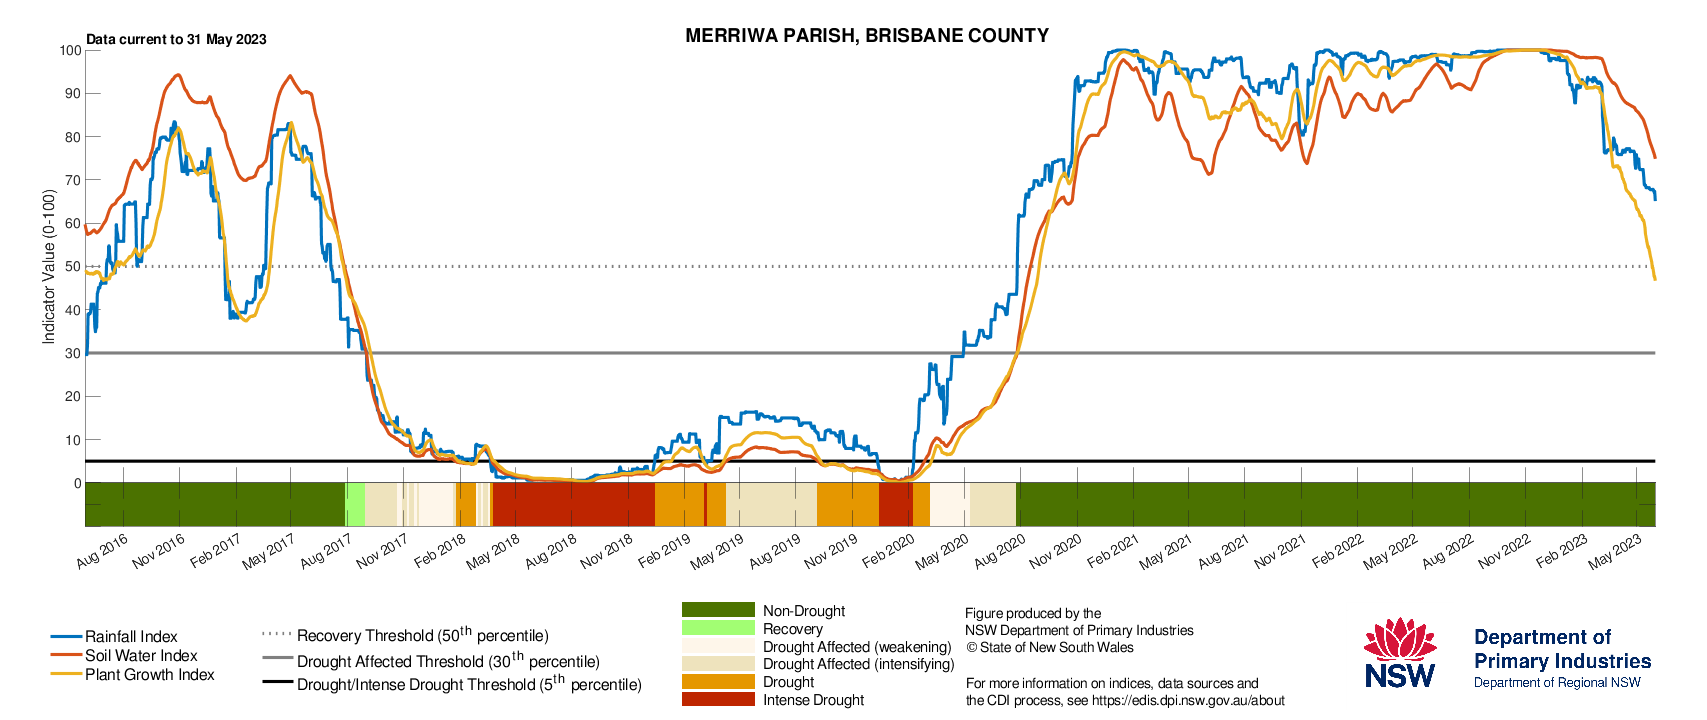
The Drought History charts (Figure 29) show the individual response of the drought indicators for Cowra, Condobolin, Singleton and Merriwa. The CDI indicators remain high at Cowra and Condobolin. Singleton has recently had a small decline in conditions and the Merriwa parish has recorded a steep decline. This steep decline at Merriwa is a result of an intense drying event over the past two-three months. These regions should continue to monitor conditions closely. To access a Drought History chart for your Parish, visit the Seasonal Conditions Information Portal.
The CDI is a tool that monitors drought conditions across NSW. The drought categories are based on assessing the response of three drought indicators: soil water, plant growth and rainfall. The indicators track the data over the past 12 months and show how the indices are tracking compared to the long-term averages. The information provided in the map is aggregated to a Parish level and provides a regional assessment of conditions. Variability within and between farms is possible and this may not be reflected in the CDI map.


, Central West (Condobolin), and Hunter (Singleton and Merriwa) show the current and historical status of the three drought indicators: Rainfall Index, Soil Water Index, and Plant Growth Index")
South East region
The Combined Drought Indicator (CDI, Figure 30) shows that the South East Local Land Services region is in the Non-Drought CDI category. May rainfall was below average for most of the region except in the far south. Farm dam water levels are variable although data is missing due to cloud cover affecting satellite imagery during the reporting period.
The seasonal NDVI anomaly data (Figure 31) shows near normal to above average levels of plant greenness across most of the region. There are areas that have below average levels of greenness. Some of the extremely negative NDVI areas (brown patches) represent water. The NSW DPI continues to closely monitor conditions in these regions.
The Drought History charts (Figure 32) show the individual response of the drought indicators at Bega, Cooma and Goulburn. Indicators have stabilised at Cooma and Goulburn due to recent rainfall. There has been a steady decline in all indicators at Bega over the past few months. Further rainfall is required to maintain productive conditions. The NSW DPI continues to closely monitor conditions in these regions. To access a Drought History chart for your Parish, visit the Seasonal Conditions Information Portal.
The Combined Drought Indicator (CDI) is a tool that monitors drought conditions across NSW. The drought categories are based on assessing the response of three drought indicators: soil water, plant growth and rainfall. The indicators track the data over the past 12 months and shows how the indices are tracking compared to the long-term averages. The information provided in the map is aggregated to a Parish level and provides a regional assessment of conditions. Variability within and between farms is possible and this may not be reflected in the CDI map.


How does it work?
Much of the information in the Seasonal Conditions Report is sourced from the NSW DPI Enhanced Drought Information System (EDIS)™. The EDIS system is currently available in prototype form and is subject to an intensive ground truthing process. For more information, visit the interactive website via droughthub.nsw.gov.au.
EDIS is an ongoing project aimed at improving the quality and timeliness of efforts to monitor conditions across the state. Key features of the system are:
- It tracks drought by using four indicators; rainfall, soil water, plant growth, as well as tracing rainfall trends. Agronomic conditions have equal value to rainfall recorded at meteorological stations.
- The Combined Drought Indicator (CDI) brings this information together and has been designed to characterise developing drought conditions. The key purpose for building the CDI was as a drought early warning system.
- The rainfall, soil moisture and plant growth indicators in EDIS account for conditions over a 12-month window. This provides a compromise between a highly sensitive indicator (e.g. six months) and a less sensitive indicator (e.g. 24 months).
- Climate and remote sensing data drive the information system at a high resolution, but the CDI is reported at a Parish level.
- Because of its configuration and purpose, there will be differences to the indicator used in the National Drought Monitoring Framework (the Australian Rainfall Deficiency Analyser) which relies on rainfall alone.
- The CDI has three drought categories that characterise NSW according to drought intensity as well as the main drivers of a drought event (meteorological, hydrological and agronomic). DPI considers areas Drought Affected to be experiencing a drought event.
- The Drought Affected category encompasses a wide range of conditions from the very early stages of drought entry through to a drought event becoming intense. This enables the drought monitoring system to detect a drought event early. It is also possible to stay in the Drought Affected category for some period of time.
The way in which the indicators are combined to form the CDI is described in Table 1 below.
Table 1: Description of the Combined Drought Indicator framework
CDI Phase | Technical definition | Description - typical field conditions |
|---|---|---|
Intense Drought | All three indicators (rainfall, soil water, plant growth) are below the 5th percentile | Ground cover is very low, soil moisture stores are exhausted and rainfall has been minimal over the past 6-12 months. |
Drought | At least one indicator is below the 5th percentile | Conditions may be very dry, or agronomic production is tight (low soil moisture or plant growth). It is possible to be in Drought when there has been some modest growth, or a few falls of rain. |
Drought Affected (intensifying) | At least one indicator is below the 30th percentile and the rainfall trend is negative over the past 90 days. | Conditions are deteriorating; production is beginning to get tighter. Ground cover may be modest, but growth is moderate to low for the time of year. When indicators are close to the Drought threshold drought conditions are severe. |
Drought Affected (weakening) | At least one indicator is below the 30th percentile and the rainfall trend is positive over the past 90 days. | Production conditions are getting tighter, but there have been some falls of rain over the past month. It is rare to enter the Recovering phase from the Non-Drought category; Usually there is a quick (1-2 week) transition into Drought Affected or Drought. When indicators are close to the Drought threshold drought conditions are severe. |
Recovering | All indicators are below the 50th percentile but above the 30th percentile | Production is occurring but would be considered ‘below average’. Full production recovery may not have occurred if this area has experienced drought conditions over the past six months. |
Non-drought | At least one indicator is above the 50th percentile. | Production is not limited by climatic conditions. |
The NSW State Seasonal Update is provided each month by the NSW DPI Climate Branch.
Information used in this report was primarily sourced from the Australian National University, Australian Bureau of Meteorology, the US National Oceanic and Atmospheric Administration, the International Research Institute for Climate and Society (Columbia University), Geoscience Australia’s Digital Earth Australia Program, and NSW Department of Primary Industries.
Maps in this document contain data which is © Spatial Services – NSW Department of Finance, Services and Innovation (2023), Panorama Avenue, Bathurst 2795 and data which is © Commonwealth of Australia 2023, Australian Bureau of Meteorology, Melbourne, and © Australian National University. All rights reserved.
The seasonal outlooks presented in this report are obtained from the Australian Bureau of Meteorology and other sources (including World Meteorological Organisation Global Producing Centres). These outlooks are general statements about the likelihood (chance) of (for example) exceeding the median rainfall or minimum or maximum temperatures. Such probability outlooks should not be used as categorical or definitive forecasts but should be regarded as tools to assist in risk management and decision making. Changes in seasonal outlooks may have occurred since this report was released.
All climate and remote sensing input data is supplied to the Enhanced Drought Information System™ under the Australian Creative Commons Licence (CCY 4.0) and is made available by the Terrestrial Ecosystem Research Network.
© State of New South Wales through the Department of Regional NSW, 2023. You may copy, distribute and otherwise freely deal with this publication for any purpose, provided that you attribute the NSW Department of Primary Industries as the owner.
Disclaimer: The information contained in this publication is based on knowledge and understanding at the time of writing (June 2023). However, because of advances in knowledge, users are reminded of the need to ensure that information upon which they rely is up to date and to check currency of the information with the appropriate officer of the Department of Primary Industries or the user’s independent adviser.
Published by the NSW Department of Primary Industries. ISSN 2202-1795 (Online). Volume 11 Issue 5.
