Industries
DPI manages a broad range of initiatives that provide resources to primary industry producers.

Working to increase the value of primary industries and drive economic growth across NSW.
DPI manages a broad range of initiatives that provide resources to primary industry producers.
To drive economic growth across primary industries, DPI focuses on innovation that improves resilience and boosts productivity, sustainable use of and access to natural resources, mitigating and managing risks to community and maintaining industry confidence. Two key strengths that support this goal are productive partnerships with business, industry and the community, and our greatest asset – our people.
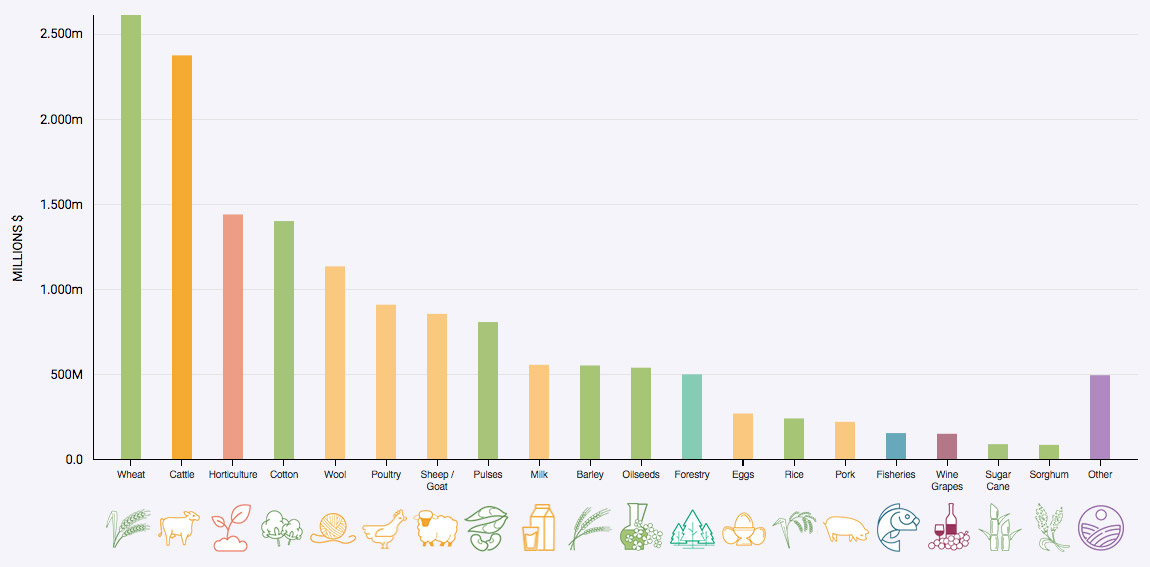
Record grain production across the state initially had grain storage facilities bulging; excellent export demand ensured that prices to producers remained steady, despite stagnant global prices. Valued at an estimated $6.8 billion, NSW crop production was underpinned by a record wheat harvest, while cotton, pulses, barley and oilseeds all made large contributions to the states output. With seasonal conditions boosting production and enhancing one half of the GVP calculation, the prices received for many of the commodities throughout 2016-17 further accentuated the final record GVP result. In particular unprecedented livestock prices helped to drive the value of production higher to an estimated $6.4 billion, despite the wetter seasonal conditions shifting many producers into herd and flock rebuilding phases.
30% Growth
Target By 2017
NSW boasts an abundant and diverse range of primary industries. In NSW, 2016-2017 was a record-breaking year for the value of NSW Primary Industries, reaching an estimated A$15.4 billion, representing an increase of 32.4% on the 2013-14 GVP level. Industry performance was determined by several key factors including the price received, productive output, the macroeconomic environment, and seasonal conditions. Seasonal conditions were characterised by above average rainfall from July through to November which secured livestock feed, helped finish winter crops and increased stored moisture levels into the warmer months.
NSW DPI has continued to work with our state and federal colleagues on developing market opportunities for our export industries, with progress made in many markets alongside some key market access developments for certain industries.
NSW boasts an abundant and diverse range of primary industries. The ability to quantify, monitor and compare the total annual value of production at the state level can be measured through the Gross Value Production (GVP). Annually, GVP is measured as a unit volume of each commodity produced by the respective commodity unit price achieved at the “farm gate” or in the wholesale market.
| Region | GVP | Contribution % |
|---|


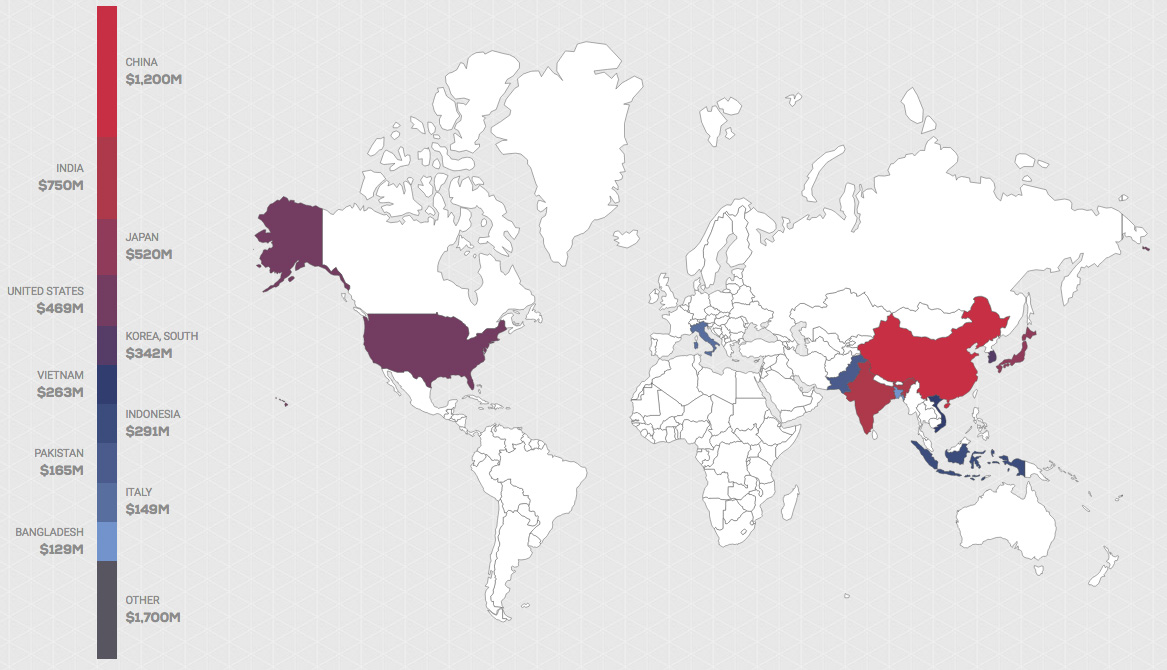
NSW primary industry exports earned $6.3 billion mainly driven by substantial increases in crop production. This equates to an increase of 22% year-on-year. The highest value exports were wheat, beef, cotton, and wool. The biggest year-on-year contributor was wheat, with the strongest percentage growth of more than 162% to $1.2 billion.
| Industry | Contribution |
|---|
Download the full publication which profiles the key drivers and provides statistics across a number of key primary industry sectors. Analysis of key factors for each industry will detail the impact on the GVP performance for each industry.