Wine Grapes

Skip to main content

Wine Grapes Overview

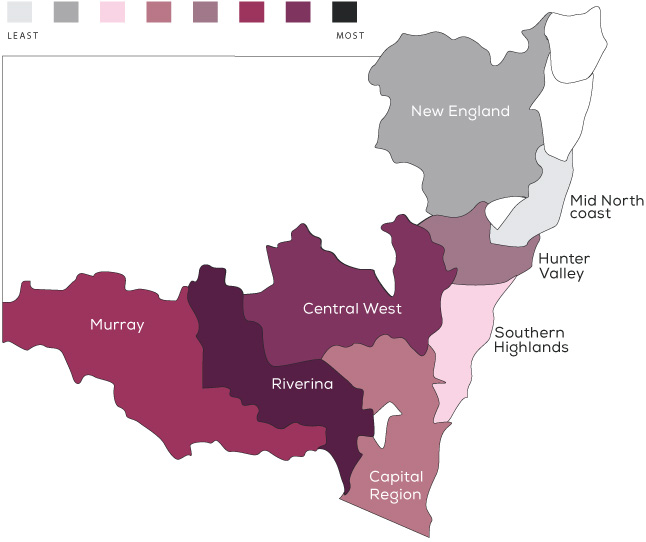
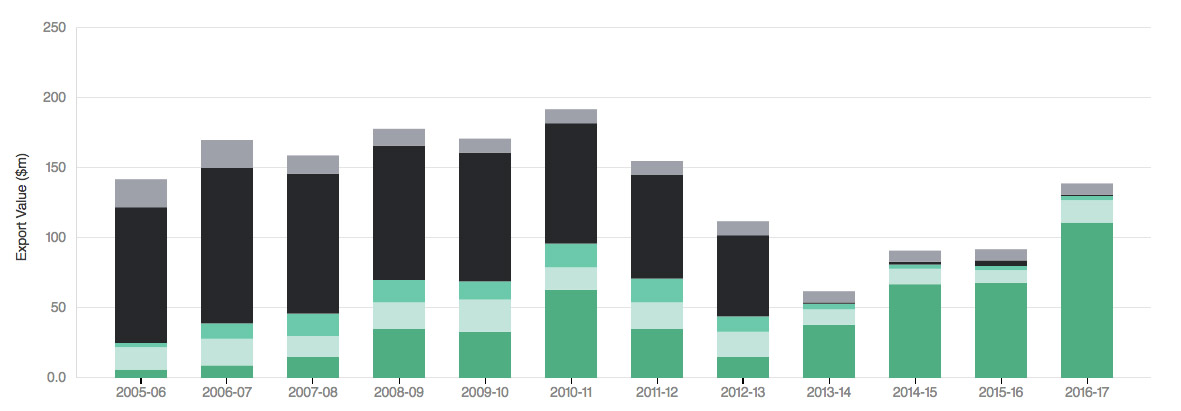
The value of wine grapes production increased solidly driven by price. Production was largely unchanged despite an increase in output from the Riverina region. Wine export growth was also muted with strong ongoing gains in growth to emerging Chinese markets offset by falls in exports to more established markets.

4 % yoy GVP
$154mest
1 % Contribution to
GVP growth
Wine Icon Exports to China continue to grow strongly

Prices paid are estimated to have increased by nearly 5% on average though results were mixed across the regions. The average price was $373 per tonne.

Production

The grape crush was up slightly year-on-year. The positive result mainly reflected steady production in the Riverina, which accounts for 89% of the volume of wine grapes crushed in NSW.

Approximately 71% of the grape crush was purchased from grape growers, with the remainder supplied to wineries through their own vineyards.

The varieties of grapes most purchased largely mirrored production with shiraz, cabernet sauvignon and merlot purchased the most out of the red varieties and chardonnay, semillon and sauvignon blanc the most purchased of the white varieties.

Regional Crush 2016-17 (tonnes)

Region Crush (t)

Regional Crush 2016-17 (tonnes)
New England & North West
0.1%31t
New Englands Australia29
Northern Slopes Zone other2
Mid North Coast
0.1%29t
Hastings River29
Hunter Valley (exc. Newcastle)
1.05%3,664t
Hunter3,238
Hunter Valley Zone other426
Central West
4.75%16,591t
Central Ranges5,202
Cowra4,014
Mudgee1,319
Orange6,056
Murray
2.35%8,214t
Big Rivers Zone other7,881
Perricoota333
Southern Highlands & Shoalhaven
0.1%44t
Shoalhaven Coast0
Southern Highlands44
Riverina
90.75%317,791t
Gundagai4,909
Southern NSW Zone Other371
Tumbarumba1,201
Riverina311,310
Capital Region
0.85%2,983t
Canberra District352
Hilltops2,631

Exports

The value of wine exports was largely unchanged. Exports to established markets, such as the United States and the United Kingdom, were lower or unchanged, while exports to China continued to grow strongly. Over the past five years exports have grown around 2.8%, with fast growth to emerging markets in China and Italy largely responsible for this growth.

NSW Wine Exports Value ($m)

Download The Publication

Download the full publication which profiles the key drivers and provides statistics across a number of key primary industry sectors. Analysis of key factors for each industry will detail the impact on the GVP performance for each industry.

Download
Publication