

Distribution maps for vertebrate pests
The NSW Department of Primary Industries periodically collects and collates data and best-available information on the distribution and relative abundance of pest animals throughout NSW.
Surveys are conducted through consultation with land management organisations, including the NSW National Parks and Wildlife Service and Local Land Services.
The maps below provide a representation of the distribution and relative abundance of many established pest species throughout NSW, at points in time between 2009 and 2023.
Some of these maps may not be accessible.
Distribution change maps 2020 - 2023
Distribution change maps 2016-2020
| Title |
|---|
| feral deer (all species) distribution change from 2016 to 2020 (PDF, 534.3 KB) |
| feral pig distribution change from 2016 to 2020 (PDF, 1.3 MB) |
2020 survey maps
| Title |
|---|
| feral pig distribution and abundance 2020 (PDF, 1.6 MB) |
| feral deer (all species) distribution and abundance 2020 (PDF, 1.3 MB) |
Distribution change maps 2009-2016
| Title |
|---|
| feral pig distribution change from 2009 to 2016 (PDF, 415.3 KB) |
| feral horse distribution change from 2009 to 2016 (PDF, 358.3 KB) |
| wild dog distribution change from 2009 to 2016 (PDF, 405.5 KB) |
| red-eared slider turtle presence 2016 (PDF, 342.9 KB) |
| deer (all species) distribution change from 2009 to 2016 (PDF, 412.4 KB) |
| feral camel distribution change from 2009 to 2016 (PDF, 350.1 KB) |
2016 survey maps
| Title |
|---|
| rabbit distribution and abundance 2016 (PDF, 420.2 KB) |
| feral goat distribution and abundance 2016 (PDF, 418.9 KB) |
| feral horse density 2009 (PDF, 100.9 KB) |
| feral donkey distribution and abundance 2016 (PDF, 343.4 KB) |
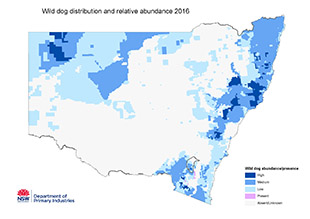
| wild dog distribution and abundance 2016 (PDF, 412.7 KB) |
| deer (all species) distribution and abundance 2016 (PDF, 618.5 KB) |
| feral pig distribution and abundance 2016 (PDF, 441.4 KB) |
| feral camel distribution and abundance 2016 (PDF, 344.1 KB) |
| feral horse distribution and abundance 2016 (PDF, 354.3 KB) |
2009 survey maps
| Title |
|---|
| red-eared slider turtle occurrence 2009 (PDF, 80.3 KB) |
| rabbit density 2009 (PDF, 214.7 KB) |
| feral livestock density 2009 (PDF, 95.9 KB) |
| feral goat density 2009 (PDF, 197.5 KB) |
| fox occurrence 2009 (PDF, 97.8 KB) |
| feral donkey density 2009 (PDF, 91.3 KB) |
| feral cat presence 2009 (PDF, 108.5 KB) |
| wild dog density 2009 (PDF, 170.3 KB) |
| wild deer density 2009 (PDF, 159.0 KB) |
| cane toad density 2009 (PDF, 81.2 KB) |
| feral camel density 2009 (PDF, 89.0 KB) |
| feral pig density 2009 (PDF, 256.4 KB) |
