

Recreational Fishing Research Surveys
Background
In 2000-01, NSW participated in the National Recreational and Indigenous Fishing Survey (NRIFS). The NRIFS provided an important benchmark in the assessment of recreational fishing in NSW and found that over 1 million NSW residents participated in recreational fishing. This survey showed recreational fishing to be an extremely important activity that brings significant social and economic benefits to the community.
During 2013-14, another state-wide survey was conducted (PDF, 2396.3 KB) enabling us to measure changes in the recreational fishery that occurred since the NRIFS.
Both surveys provided state-wide and regional assessments of participation, effort and catch for recreational fishing done in NSW. Regular assessment of motivational factors, opinions and satisfaction levels of recreational fishers were also obtained during these surveys.
How do we collect the information?
The RFMP Research Surveys uses a Telephone-Diary Survey method to collect information on recreational fishing in NSW. This method is widely accepted as the most cost-effective means to collect robust representative information on recreational fisheries over large spatial scales and has been used successfully in previous national and state-wide surveys in Australia and overseas.
This method involves an initial phase where trained interviewers screen thousands of randomly-selected long-term (1 & 3 year) recreational fishing licence (RFL) holders, which provides a representative sample of recreational fishers for participation in the survey. These fishers then keep a simple diary of their fishing activity, which is recorded by trained interviewers during regular telephone conversations. Information is collected on what is caught, how many people go fishing, how often and for how long, as well as fishers’ opinions, attitudes and motivations related to recreational fishing.
These ongoing Recreational Fishing Research Surveys are done every second year (biennially) with the first survey being completed in 2017/18. The 2023/24 survey is currently underway. These surveys provide high quality data to compare catches over time and assess trends in recreational fishery performance on a state-wide basis.
Results
 by waterbody")
In 2021/22, there were more than 460,000 current NSW long-term RFL holders. From these, nearly 2,000 were initially screened for participation at random, of which more than 1,000 completed the 12-month survey reporting their household’s fishing information from approximately 6,400 fishing events.
The survey found that state-wide, 340,000 fishers within active RFL households fished for an estimated total fishing effort of 1.7 million fisher days. More than 85% of fishers were NSW residents, with the remainder being residents of the ACT, Queensland or Victoria.
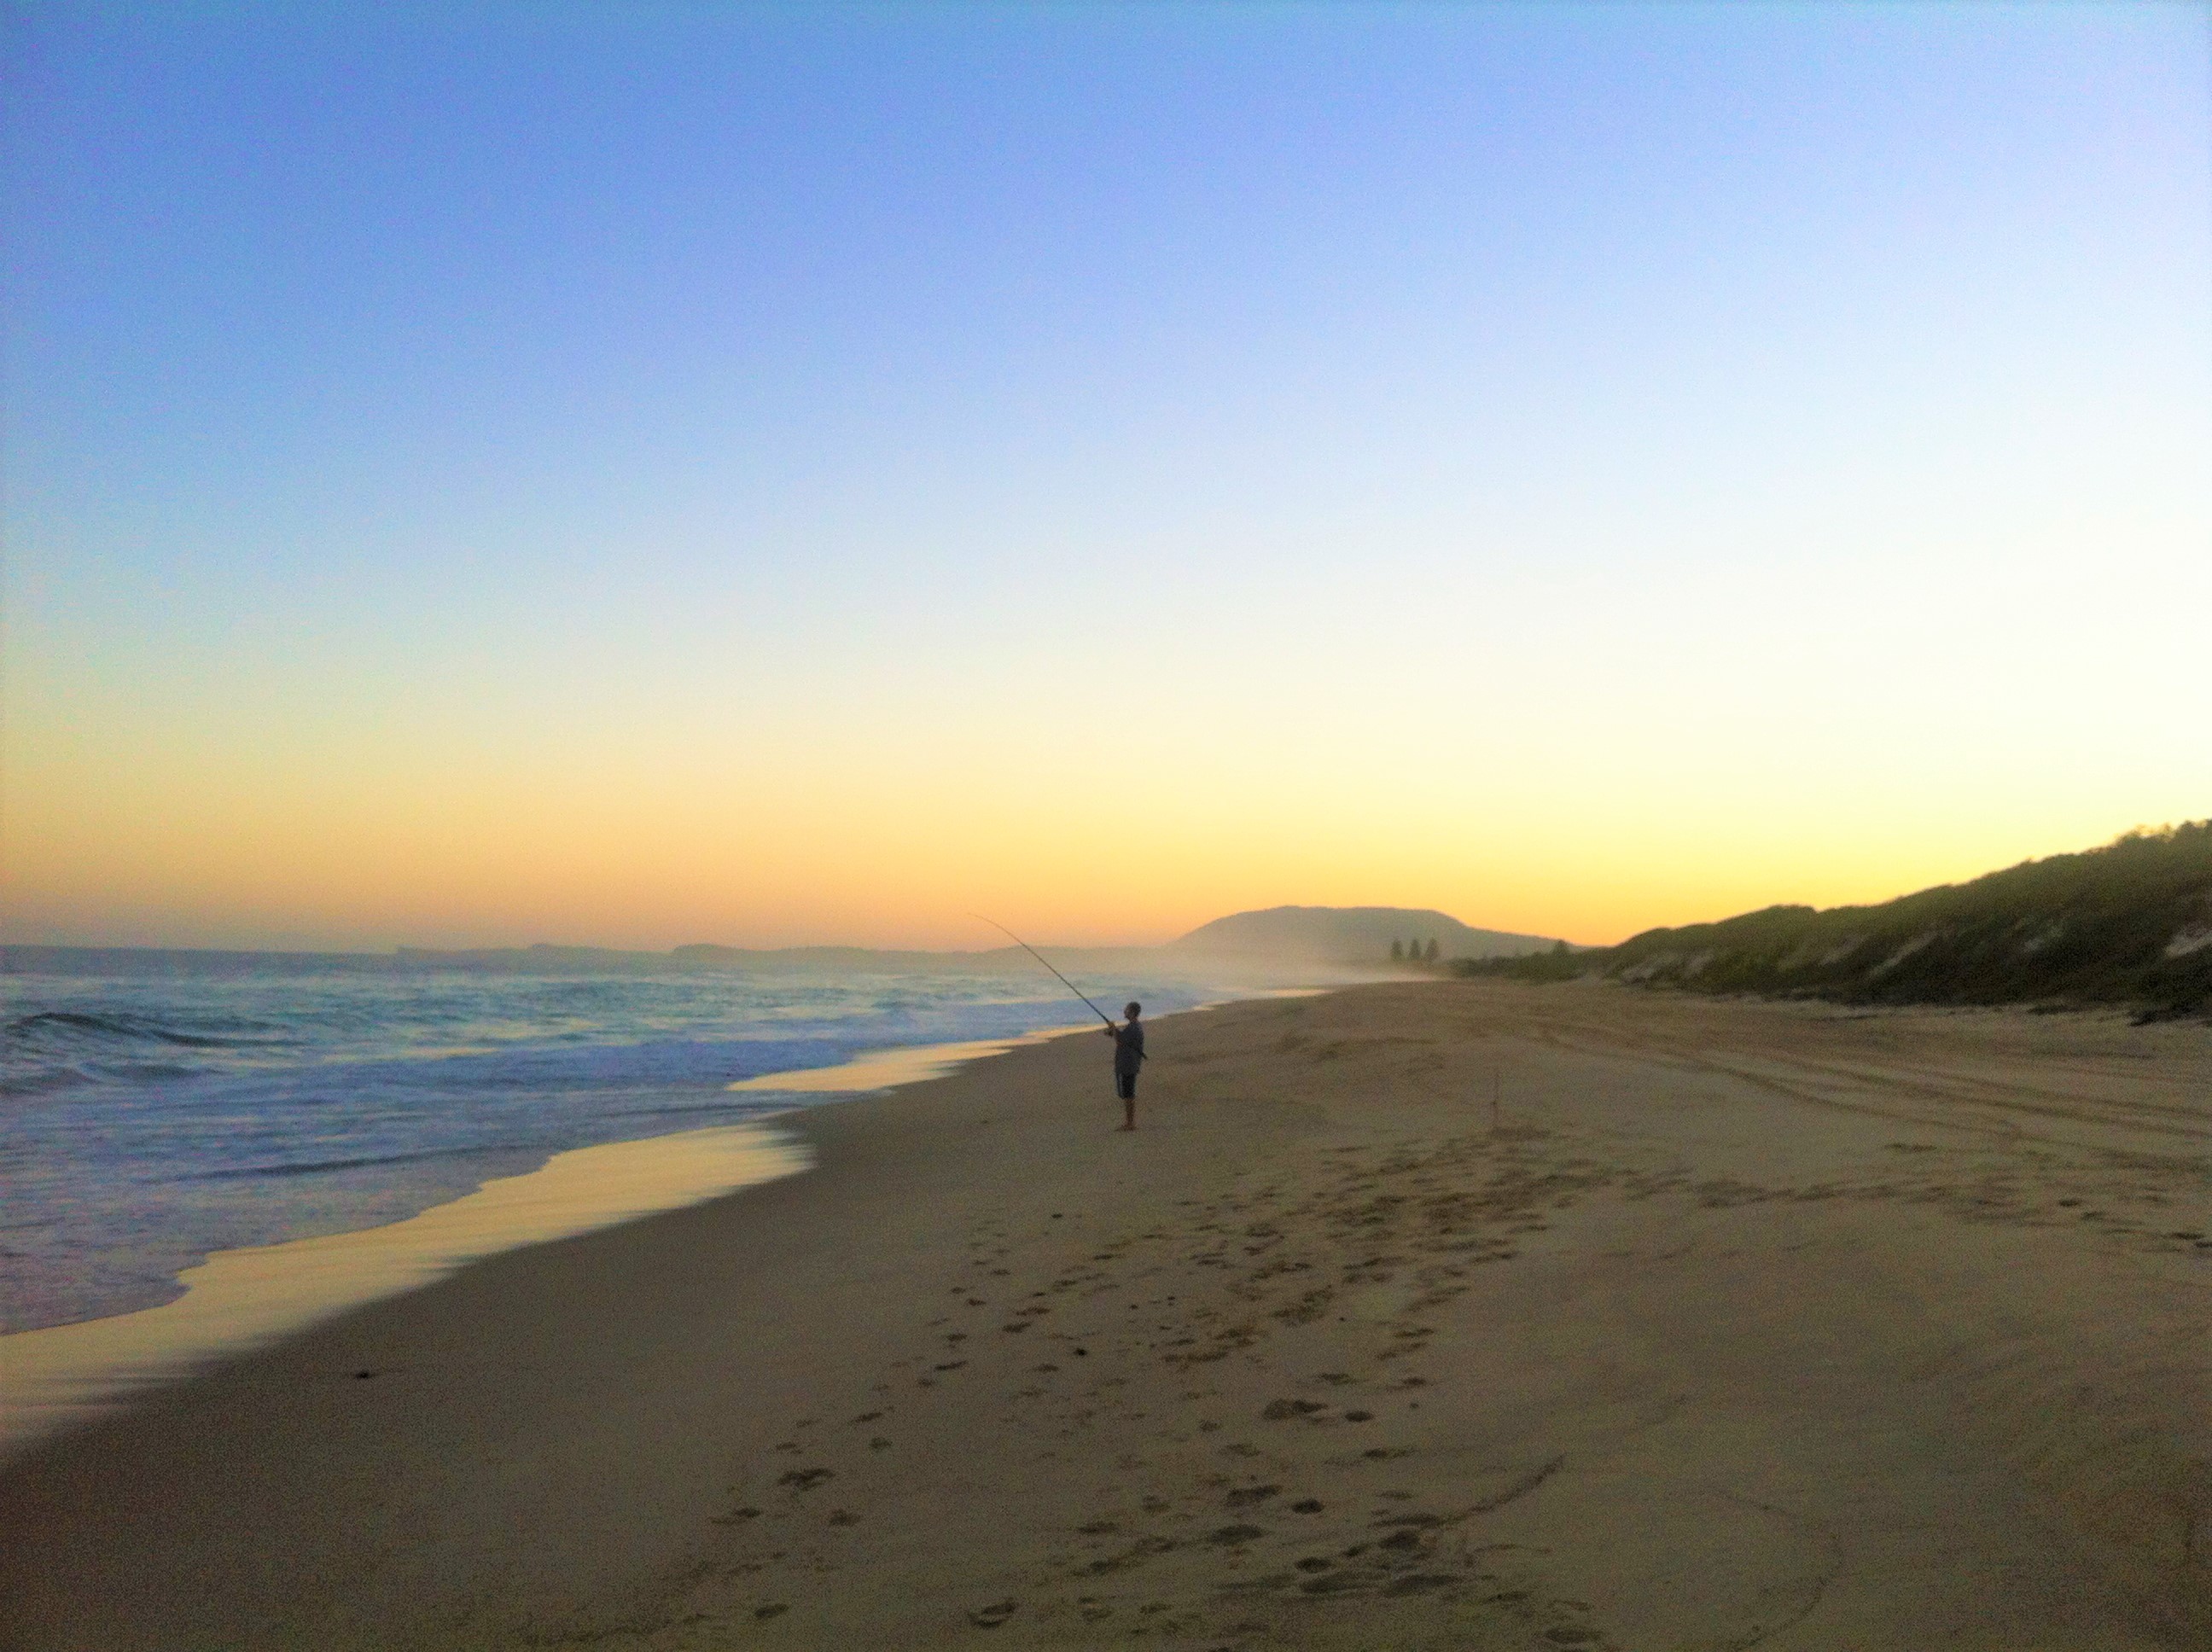
Most fishing occurred in saltwater, primarily in estuaries (50%) followed by inshore and offshore marine waters (20%). The majority of freshwater fishing took place in rivers (19%) with less occurring in lakes and dams (11%).
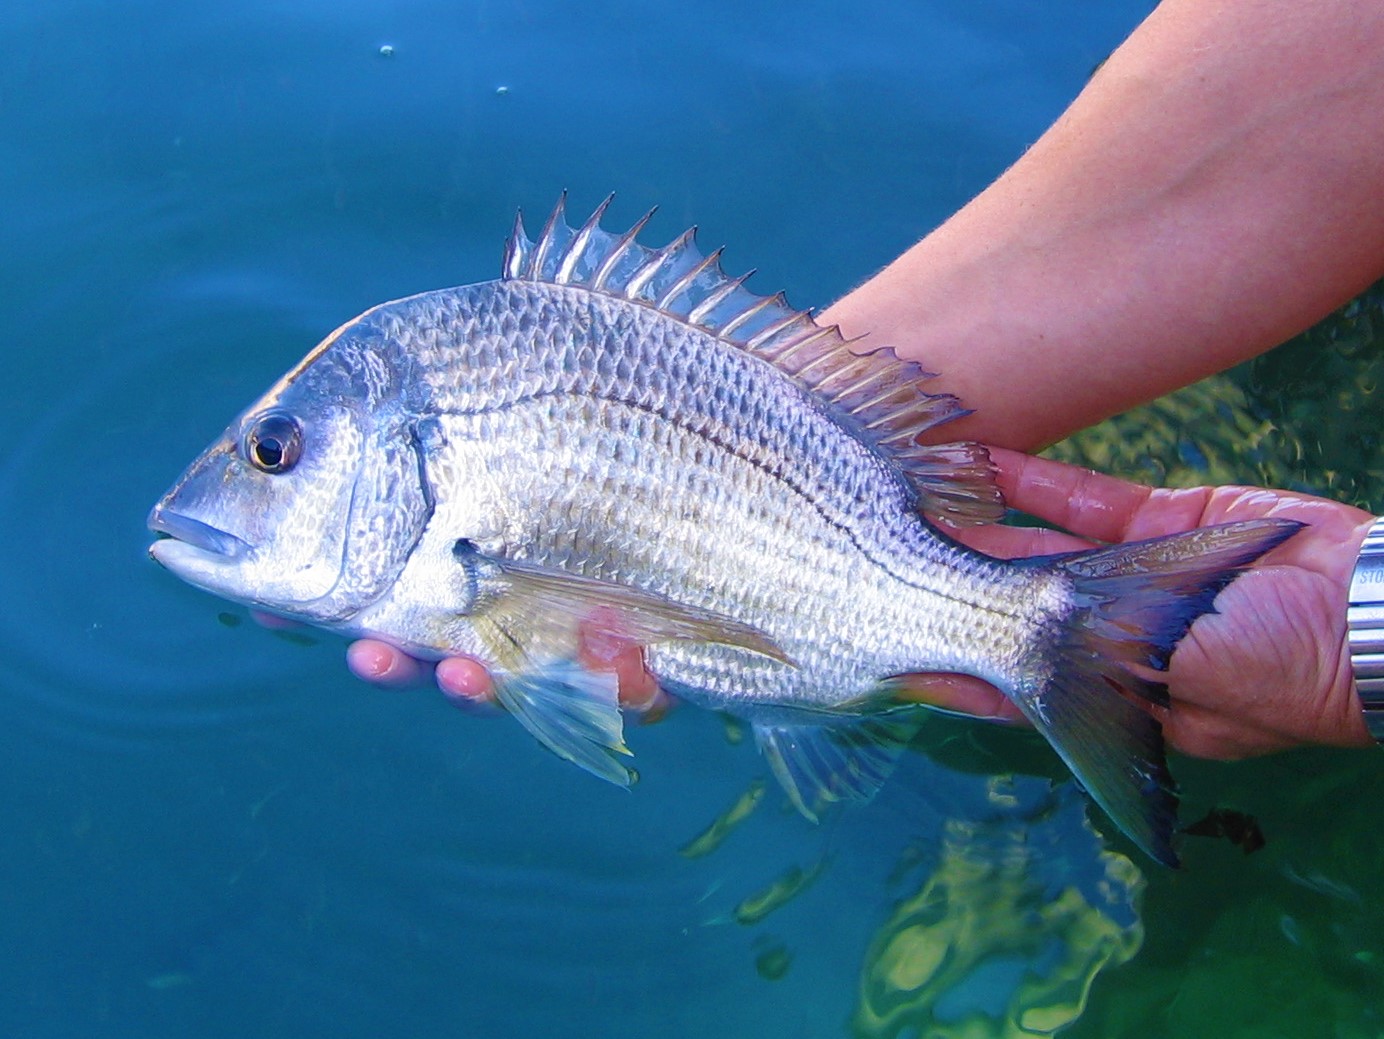
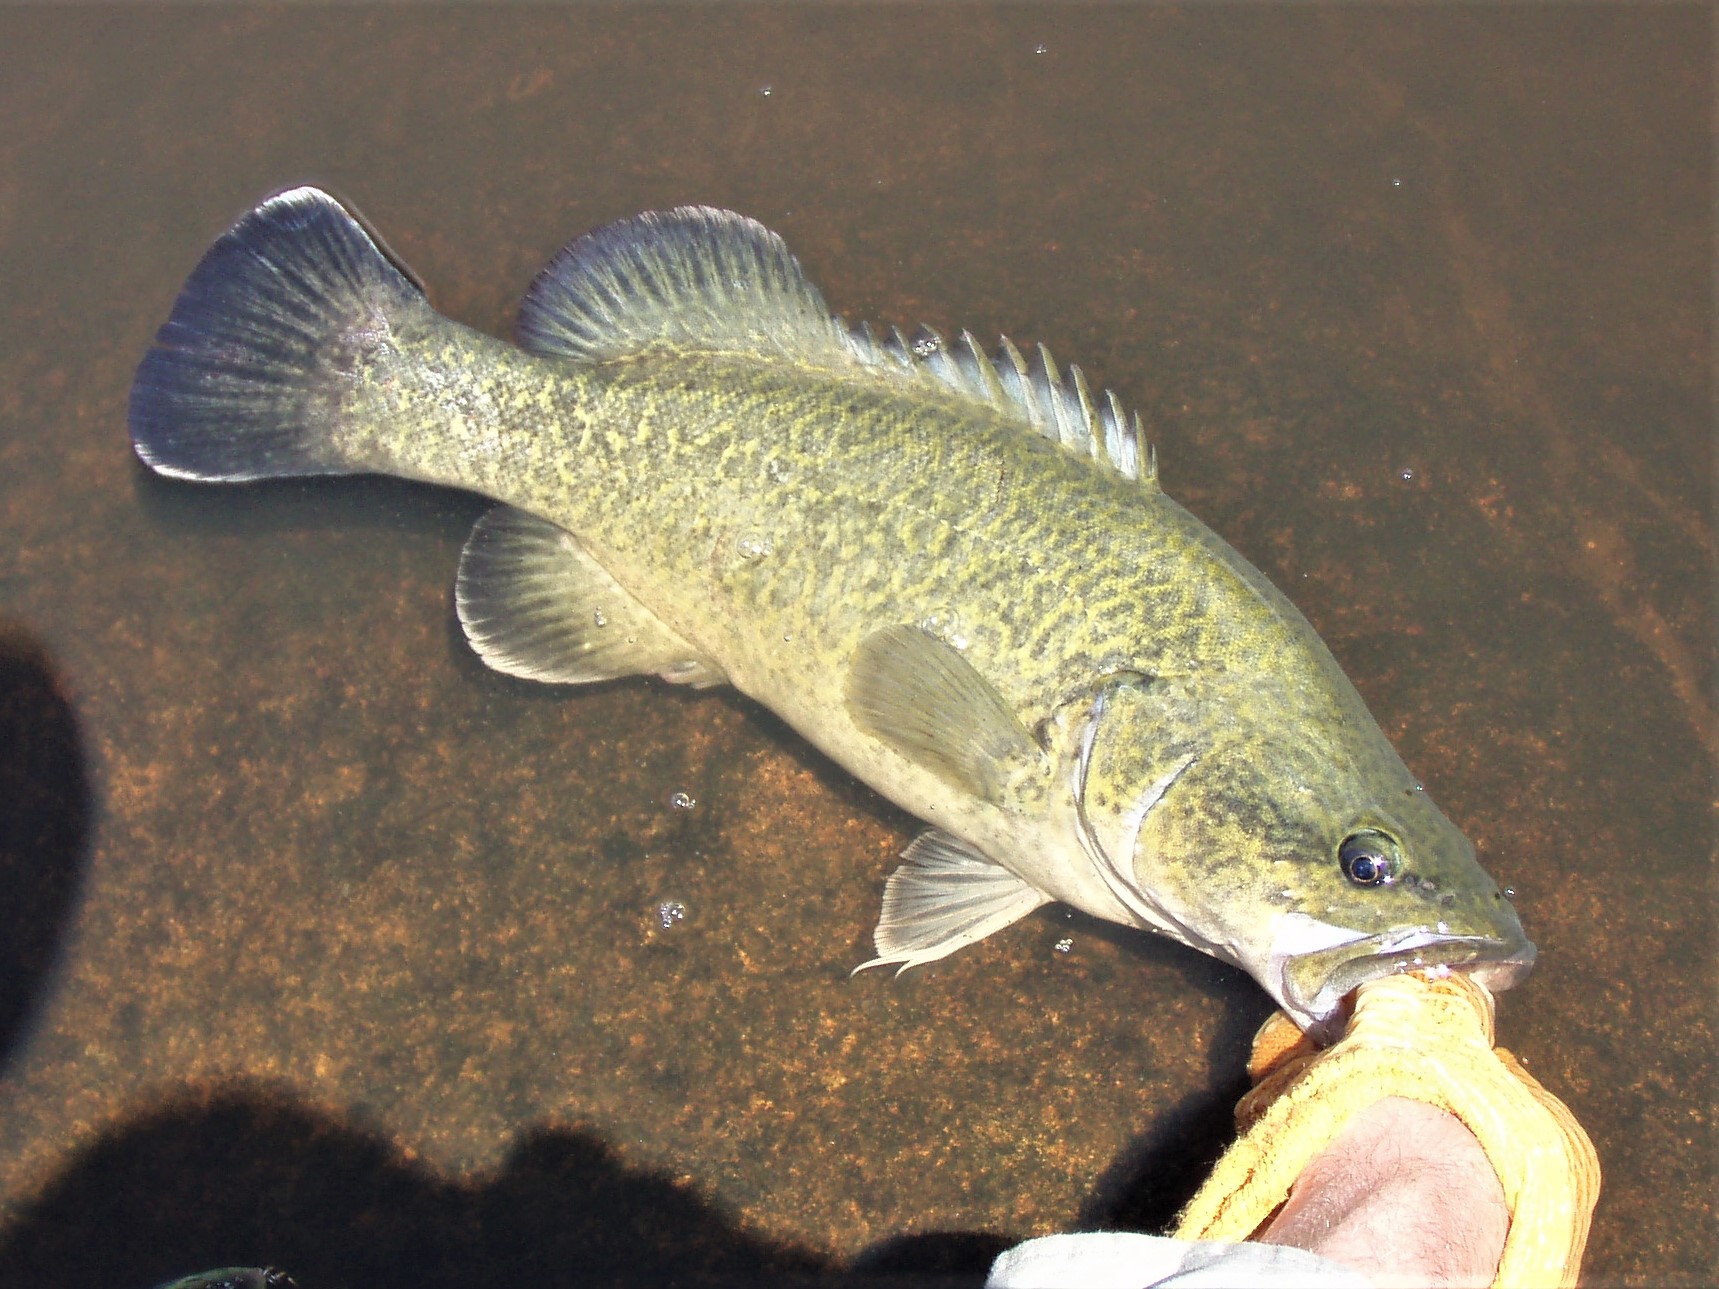
State-wide, it was estimated that approximately 7.7 million individual organisms (fish and invertebrates) were caught (including kept and released) of 123 different species. The top five saltwater finfish species caught were Bream (1,112,700), Dusky Flathead (515,200), Snapper (306,900), Sand Whiting (302,200) and Yellowtail Scad (217,200). Among freshwater fish, Redfin Perch (349,600) was the most common species caught, followed by Murray Cod (335,500), European Carp (292,600), Rainbow Trout (176,400) and Brown Trout (160,900). The top five invertebrate species caught were Saltwater Nippers (708,500), Freshwater Shrimp (342,100), Saltwater Prawns (332,900), Yabbies (259,600) and Squid (92,200).
More than half (53%) of the individual organisms caught were subsequently released, with release rates varying considerably by species.
.")
Where do recreational fishers fish – and what did they catch?
Hover and click interactive map showing the top five species caught and fishing effort (fisher days) by fishing region (for best view, please click “View larger map” link below
Report
The full report – "Survey of recreational fishing in NSW 2021/22" can be found here (PDF, 10391.03 KB).
Appendices
Appendices listed at the end of the report can be found here (PDF, 702.93 KB).
Past Reports
Past reports from previous recreational fishing surveys undertaken in NSW can be found here:
- Survey of Recreational Fishing in New South Wales and the ACT, 2013/14 (PDF, 3900.7 KB).
- Survey of recreational fishing in NSW, 2017/18 (PDF, 6593.86 KB)
- Survey of recreational fishing in NSW, 2019/20 (PDF, 14789.39 KB)
