

cropping
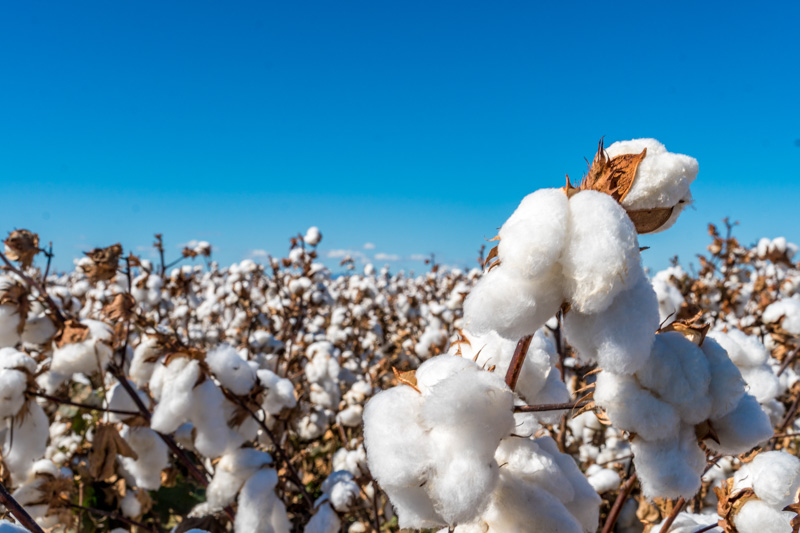
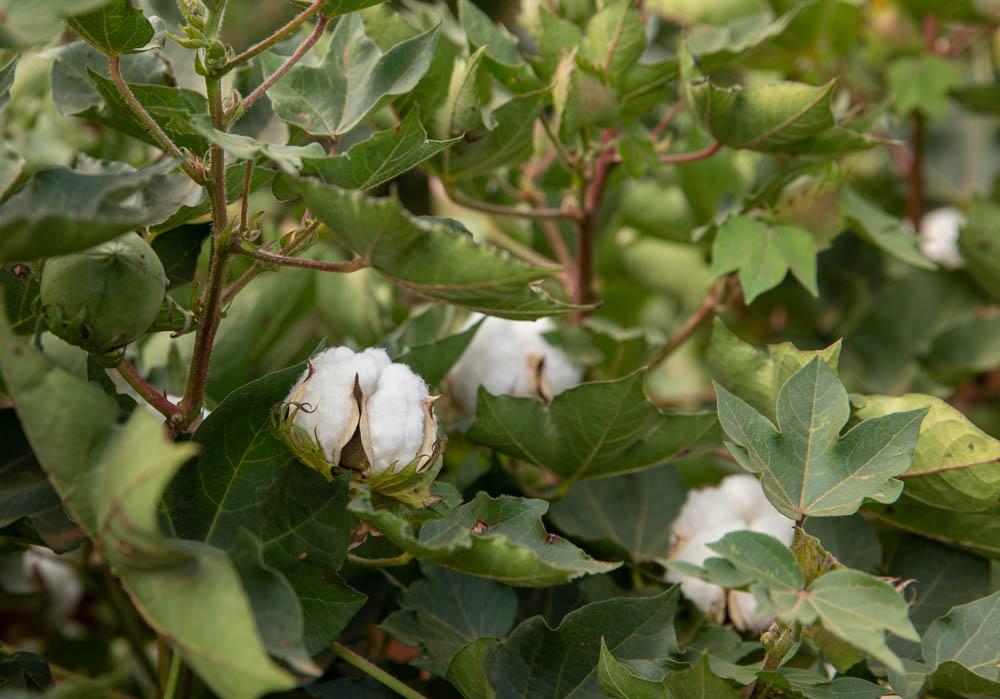
Cotton
- GVP $847 million est. Up 383% yoy.
- Strong global cotton price offsetting diminishing local basis.
- China export market share fell 31 percentage points yoy.
Australian Cotton Research Institute, Narrabri
Research activities at the ACRI have played a key role in the development of cotton in New South Wales and Queensland. Scientists at ACRI are assisting the cotton industry to develop a sustainable future based on productivity and best practice natural resource, disease and pest management.
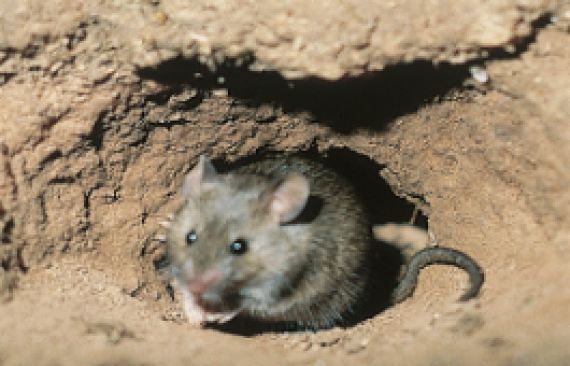
Mice plague household and small business rebates now available online
Deputy Premier John Barilaro said eligible households can claim up to $500 and small businesses up to $1,000 to help meet the cost of mouse baits, traps and cleaning materials bought after 1 February 2021.
“These rodents haven’t just impacted farmers and crops, they have also been a scourge on homes and businesses right across the regions,” Mr Barilaro said.
“Fighting this plague has come at a financial cost and this rebate is putting money back in the pockets of hard-working families and business owners.
Production
NSW Cotton Production & GS Water Allocations a
- GS Allocation South
- GS Allocation North
- Cotton Production (RHS)
* 227 kg cotton bale
Most of NSW production comes from irrigated cotton production, with dryland cotton production accounting for approximately 9% of overall production over the last 10 years. 25 The contribution from southern NSW has been increasing steadily with 28% of NSW cotton production coming from this region in the five years to 2019-20, versus 14% in the five years to 2014-15. 25
The season favoured warmer growing climates, with a cooler summer delaying the maturity and harvest of the crop and resulting in some quality issues in the southern growing regions. Growers in these regions saw up to half of the cotton fall into a low micronaire range, which will result in a discount to the contracted cotton bale price for these producers. 177
Price
Basis premiums in the domestic markets were running either at parity or greater with the Cotlook A index prices and US futures contracts, however, this basis has since eroded with domestic spot prices ending the year below the Cotlook A indicator and at parity with the US futures price. 81 143 177 178 This is attributed to increasing demand from Chinese mills which are excluding Australian produced cotton imports. The Chinese government has imposed unofficial trade pressure through their domestic mills, encouraging them to source cotton from other markets, with the US being a major beneficiary. 26
Cotton Prices
- Local Spot Price
- Cotlook A Index
- US Futures #2
Trade
Cotton exports to China have slumped since October, when reports of a Chinese unofficial boycott of Australian cotton surfaced, although they have not halted completely, with a spike in exports in March 2021 post reports of the ban. Market share to China fell 3 percentage points to 45%, however this trend is likely to continue downward if the Chinese imposed boycott continues. Positive signs have emerged from Vietnam, Indonesia and Turkey with market share to these destinations improving by 15, 1 and 6 percentage points respectively. 128 Market access challenges will likely be felt more acutely in the two forward financial years due to larger crops, with the impacts expected to be evident through Australian cotton basis.
Macroeconomic Conditions
At the same time global cotton production is estimated to fall by 7% to 113 million bales. This decline in production is attributed to the US where production is estimated to have fallen by 27% year on year, or by 5.3 million bales, and Brazil where production is estimated to have fallen by 18% year on year, or by 2.5 million bales. 207 A range of factors led to lower US cotton production, including lower relative prices compared to substitute crops and lower planted acres, high abandonment rates, hot and dry conditions and tropical storms which reduced yields in some production regions, particularly in Texas. 213 Ultimately this has meant a 5% decline in global ending stocks and a direct positive impact on cotton market prices. 207
Global Cotton Supply and Demand l
- China Ending Stocks
- ROW Ending Stocks
- Domestic Consumption
- Production
Outlook
On a global level, cotton consumption is forecast to reach the second highest level on record at 122.6 million bales l aided by the global economic recovery, government stimulus and a return of consumer spending on apparel products. 207 Consumption is expected to again outstrip production to the tune of 3.7 million bales l . This is broadly being interpreted as a supportive factor of futures contracts which are were sitting around 97 US cents/lb as at 28 Sept – or approximately AUD $670/bale at respective exchange rates. 139 178
