Fisheries

  • GVP $202.5 million est. Up 2% yoy.
  • Aquaculture continued to increase its contribution to overall fisheries Output.
  • The value of the wild harvest sector exceeded $100 million for fourth consecutive year.
DPI analysis u estimated the value of the NSW fisheries during 2020-21 at $202.5 million, up 2% year-on-year. The aquaculture sector suffered setbacks due to the floods and coastal inundation of early 2021 causing losses and damage to estuarine aquaculture production. Seafood prices were either stable to slightly weaker depending on the commodity with trade impositions, lockdowns and fluctuating food service demand being contributing factors. ac

Contribution of aquaculture and wild harvest sectors to total fisheries Output

  • Wild Harvest
  • Aquaculture
Source: DPI (2015) , DPI (2016) , DPI (2017) , DPI (2018) , DPI (2019) , DPI (2021) , DPI (2021) , DPI (2020)
Fishing boat on the open sea

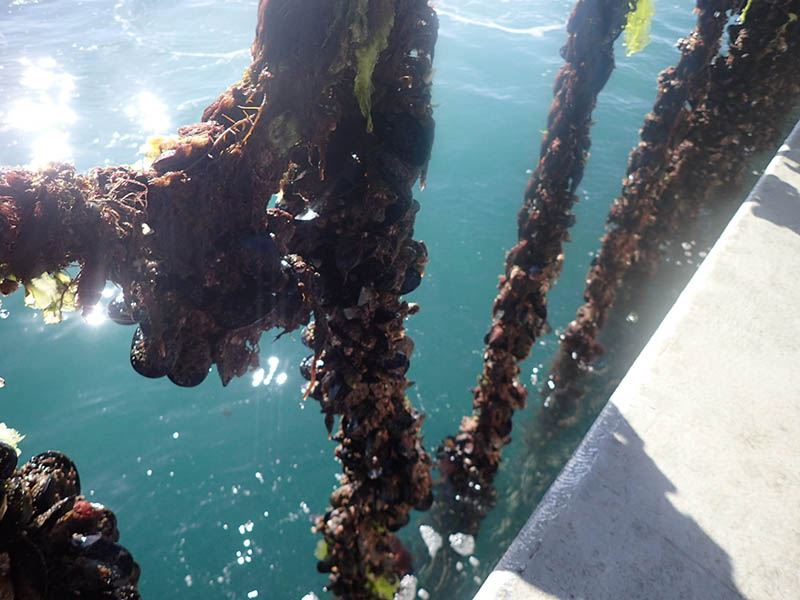
Jervis Bay marine waters aquaculture leases

NSW DPI has supported the expansion of the aquaculture industry into marine waters. The completion of environmental impact statements and development of marine waters leases resulted in the NSW Marine Waters Sustainable Aquaculture Strategy, a regulatory and industry best practice legislative framework, which is now being used to attract and guide future aquaculture investment to NSW.

Leases in Jervis Bay were successfully obtained by South Coast Mariculture, who have established 20 longlines stocked with locally caught mussels, stock moved from Twofold Bay under a biosecurity translocation protocol, and stock supplied by DPI’s Port Stephens Fisheries Institute. They are also working closely with Venus Shell Systems that produces a range of algae based nutra- and pharmaceuticals.

Find out more
back arrow
forward arrow

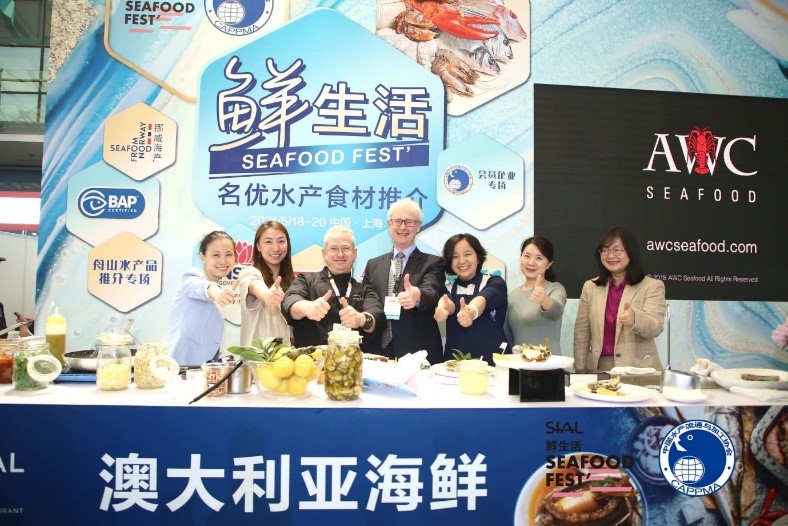
DPI international seafood showcase
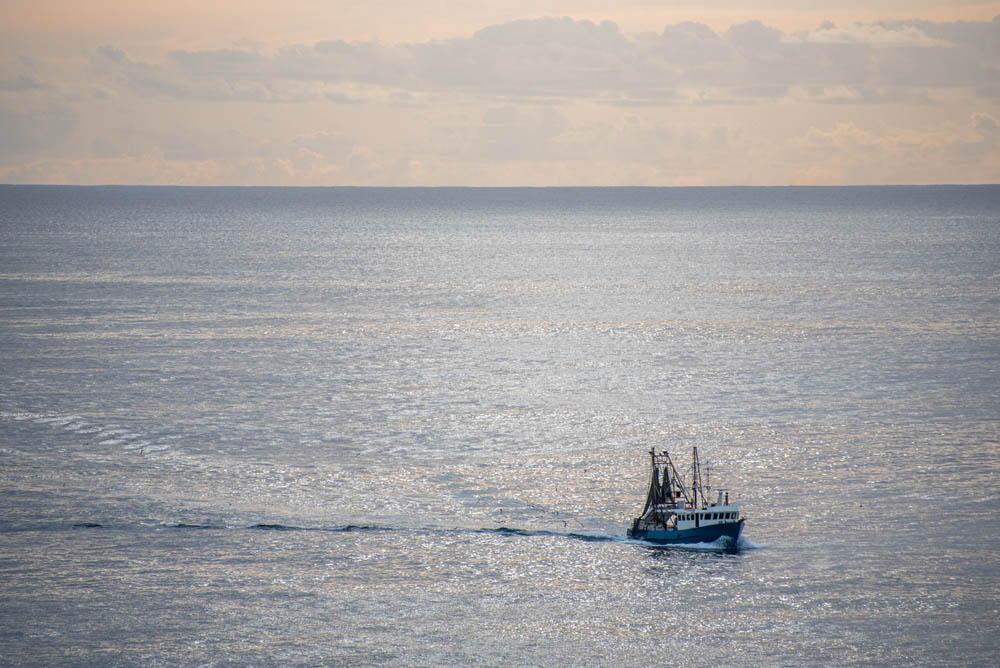
NSW DPI undertook its first ever live seafood tasting in May 2021 at SIAL China, Asia’s largest food and beverage innovation exhibition. A great success, the event was supported by bilingual marketing and promotion to convey the core message that “Australia's pure and natural waters breed delicious, healthy, high-quality, safe, and sustainable seafood”. The event attracted an online audience of 36,600 who watched live as hundreds of attendees enjoyed two of NSW’s most iconic species, Sydney Rock Oysters and Blacklip Abalone, live and fresh from NSW.
back arrow
forward arrow

Wild Harvest

The wild harvest sector Output value was $109.2 million in 2019-20, an increase of 2.1% year-on-year. While the value of the sector continued to grow, up 2% year-on-year and 21% over 5 years, the catch volume has remained consistent during the 5 years. In 2019-20, the wild harvest sectors contributed 55% to total fisheries Output.

New South Wales fisheries are managed via limits on the allowable catch (maximum amount of a particular species that can be taken by commercial fishers) or effort (maximum amount of fishing effort (e.g. days) that can be used by commercial fishers). These controls ensure the long-term viability and sustainability of the NSW commercial fishing industry.

Commercial wild harvest Output

  • Crustacean
  • Fish
  • Mollusc
  • Other
  • Grand total
Source: DPIE (2021)

Commercial wild harvest Output

  • Estuary General
  • Estuary Prawn Trawl
  • Inland
  • Ocean Hauling
  • Ocean Trap & Line
  • Ocean Trawl
  • Southern Fish Trawl
  • Abalone
  • Sea Urchin & Turban Shell
  • Lobster
  • s37 Permit
  • Grand total
Source: DPIE (2021)

Aquaculture

Aquaculture Output grew to $89.5 million in 2019-20, up 11.3% year-on-year, and up almost 50% over the 5 years from 2014-15. Aquaculture contributed 45% to total fisheries Output. During 2019-20, like other industries, aquaculture felt the impacts of Covid-19 related restrictions. Export markets suffered as did domestic trade, particularly in the supply of products to restaurants. Early 2019-20 also saw devastating bushfires followed by heavy rainfall which greatly affected water quality in many regions of the NSW coast.

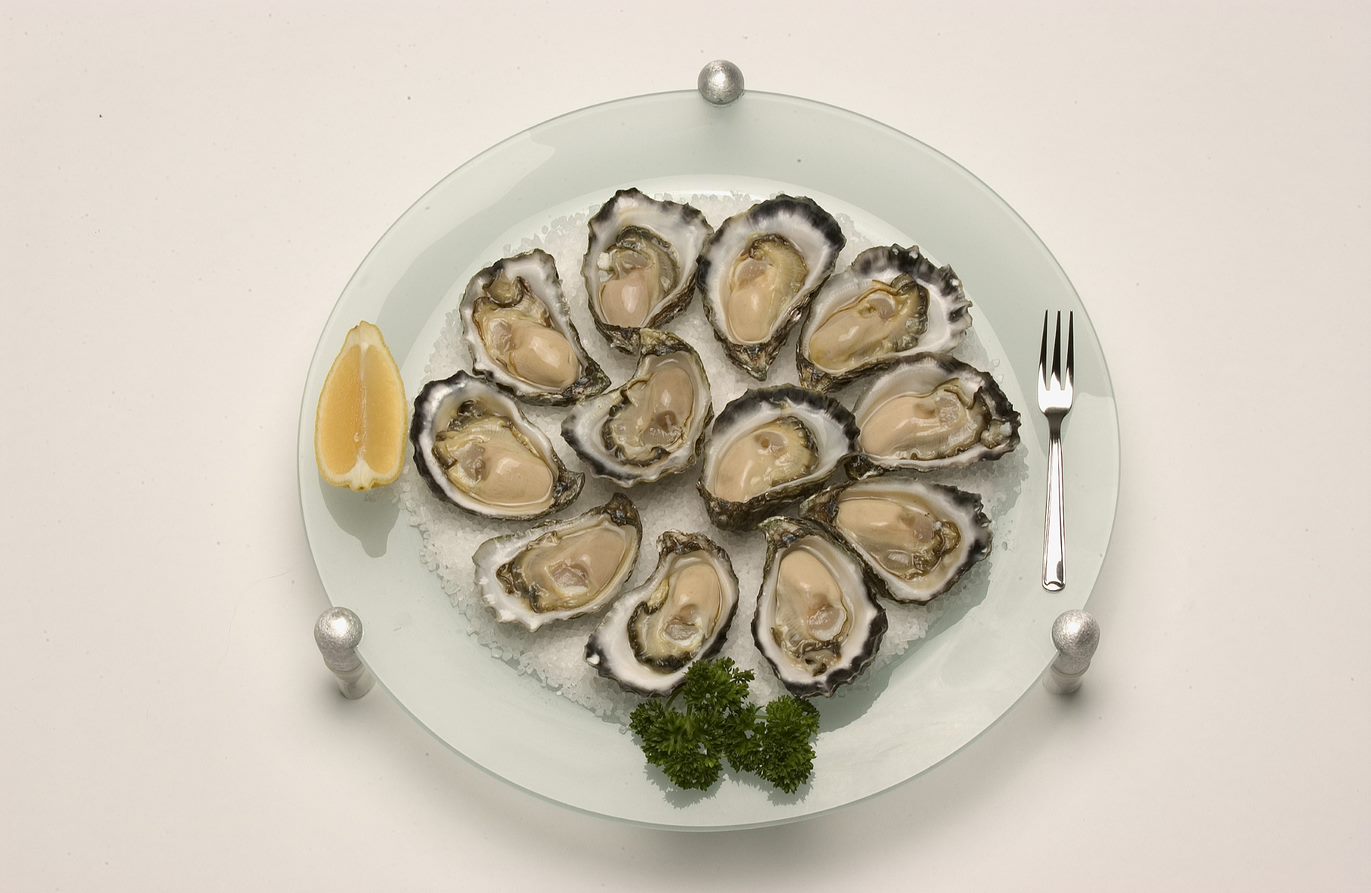
Despite these challenges, many sectors thrived. Murray Cod continued several years of strong growth to reach $7.5 million, up 16.8% year-on-year. Black Tiger Prawns reversed the trend of recent years – with production commencing in two refurbished farms, Output grew almost 3-fold year-on-year to a value of $9.9 million. Sydney Rock Oysters, although still the largest aquaculture sector by far, suffered under the conditions, down 5.3% year-on-year to $50.8 million.

Oysters

Aquaculture Output 2019-20

  • Crustaceans
  • Black Tiger Prawn
  • Yabby
  • Yabby (bait)
  • Freshwater Fish
  • Barramundi
  • Silver Perch
  • Rainbow Trout
  • Murray Cod
  • Hatchery species
  • Molluscs
  • Sydney Rock Oyster
  • Oyster Spat
  • Pacific Oyster
  • Native Oyster
  • Other species
Source: DPI (2021)

Trade

NSW Fisheries Exports af

  • Fish
  • Crustaceans
  • Molluscs
  • Miscellaneous
Source: GTA (2021)
After a drop in export sales the year prior, NSW fisheries recorded strong export growth in 2020-21, with exports reaching $29.3 million v , up 34% year-on-year. Japan remained the largest export market for NSW fisheries products at $9.9 million, however the biggest growth in value came from the United States which overtook China to become the second largest market at $6.2 million, up 94% year-on-year. Indonesia has traditionally been a relatively small fisheries export market for NSW, however recorded exceptional growth in percentage terms in 2020-21 to reach $1.7 million.

The majority of NSW fisheries exports are fish related products, with various tuna species (Southern Bluefin, Yellowfin and Big Eye Tuna) and Atlantic Salmon alone making up 52% of overall exports, while crustaceans (including Rock Lobster) make up less than 1% of national exports. Nationally Lobster exports have fallen nearly 30% year-on-year and 49% from 2018-19 levels as the impact of China’s trade impositions in took effect. In contrast, exports to Hong Kong and Taiwan increased sharply year-on-year. Valued at approximately $3.9 million in 2020-21, wild caught Abalone made up 96% of NSW mollusc exports, with China, Japan, Hong Kong and Vietnam being the major destinations.

NSW is a net importer of seafood, with a massive net trade balance of $788 million in 2020-21, indicating the level of demand for seafood domestically. The main countries of origin for imported seafood were Vietnam, Thailand, New Zealand and China respectively although there were many other key import markets. Prawns, preserved tunas, mussels, fish and fish fillets were some of the key import products.

Murray Cod Aquaculture

Murray Cod is the largest Australian freshwater fish. Endemic throughout the Murray-Darling Basin, from south east Queensland, through NSW, into Victoria and South Australia, and is recognised as a premium product. Murray Cod aquaculture in NSW is focused in the Riverina region, with 17 permit holders in 2019-20 supplying the pond-grown, white-fleshed fish primarily to high-end restaurants, wholesalers and export markets.

Murray Cod aquaculture is a growth industry with huge potential benefits for regional areas. Over the last 10 years, production of Murray Cod in NSW has increased from 5 to 421 tonnes, with production value reaching $7.5 million in 2019-20. In order to sustain the growth in both production and value, new markets are being explored and developed, and will support regional jobs growth.

Murray Cod
DPI is assisting the industry achieve access to international markets. This includes providing evidence-based scientific research to support negotiations on technical market access requirements and advocating Murray Cod’s market access priorities. The team currently is working with the industry on chilled and frozen Murray Cod products’ access to the China Approved Species List of Import Seafood (in addition to currently permitted live fish). Efforts to leverage the expansion of the current market access will help both the growth of the industry and regional economies.

Murray Cod production

  • Tonnes
  • Value ($million)
Source: DPI (2015) , DPI (2016) , DPI (2017) , DPI (2018) , DPI (2019) , DPI (2020) , DPI (2021) , DPI (2021)