

The outlook for fruit and vegetable demand remains positive with renewed consumer interest in fresh fruit and vegetables in diets, and as economies reopen and income growth within export markets including east and south east Asian countries resumes.
Horticulture
- GVP $2,031 million est. Unchanged yoy.
- Area dedicated to horticultural industries totaled 92,430 ha in 2019-20, 9% lower yoy.
- Berry production valued at $258 million in 2019-20.
Horticultural industries
u
have been impacted by a number of factors including the Covid-19 pandemic which has altered consumer behaviour, disrupted market supply chains and limited the potential availability of labour necessary to complete crop management and harvest functions. Additionally, the effects of drought and bushfires in 2019-20 on perennial crops especially orchards, in areas of the state continue to be felt. During 2020-21 key exports such as oranges were impacted by drought effected supply and market access issues, while nut exports were similarly impacted by some short-term changes in consumer buying patterns and supply chain issues, consequences of the global pandemic. Despite these challenges the horticultural industries are expected to achieve a gross value of production of $2,030 million for 2020-21.
Defending deciduous fruit orchards
A guide to help NSW’s fruit growers protect the state’s $700 million dollar fruit crops from pests and diseases is now available.
Get the guide
NSW Department of Primary Industries (DPI) Temperate Fruits Development Officer, Kevin Dodds said one of DPI's most popular annual guides, the Orchard plant protection guide for deciduous fruits in NSW gives growers up-to-date information to protect their orchards from pests and diseases and maximise the production of quality fruit for market.
The guide is available free to commercial fruit growers and is distributed through rural retailers and key industry bodies in pome and stone fruit growing regions.
New guide to protect berry production
The latest edition of the Berry Plant Protection guide 2021-2022 is available to assist growers with quality crop production and provide technical information on all aspects of protecting plants from major pests, weeds and diseases.
Published by the NSW Department of Primary Industries (DPI) the guide is a valuable tool for Australian blueberry, raspberry and blackberry growers.
More information
Image: NSW DPI berry development officer Melinda Simpson with the new Berry Plant Protection Guide.

Production
Horticulture output by value, 2019-20 u
-
Nurseries, Cut Flowers & Turf
- Nurseries
- Cultivated turf
- Cut flowers
-
Vegetables
- Mushrooms
- Melons
- Potatoes
- Other vegetables
-
Fruit
- Oranges
- Table grapes
- Apples
- Other Fruit (Excl. wine grapes)
-
Nuts
- Macadamias
- Almonds
- Other nuts
Source:
ABS (2021)
Horticultural output in 2020-21 is estimated to be valued at $2,030 million and so broadly unchanged from the value achieved in 2019-20. The agricultural land area dedicated to horticultural industries decreased by 9% in 2019-20 to 92,430 ha from the prior year 2018-19.
17
18
Several factors impacted the horticultural industries in 2020-21 the Covid-19 pandemic which has altered consumer behaviour, disrupted market access and limited the availability of labour necessary to complete crop management and harvest functions. Additionally, the carryover impacts of drought and bushfires in 2019-20 on perennial crops, especially orchards, in some areas of the state, continue to be felt.
Labour shortages remain a concern for horticultural industries as a result of the Covid-19 pandemic. An estimated 6% of horticulture’s casual labour requirements are met from Australian or permanent residents, with the majority drawn from seasonal worker and working holiday visa holders. Most of the demand for casual labour is for fruit production, accounting for an estimated 85% of horticulture’s casual labour over the period July 2020 to December 2021. 102 Fruit is generally reliant on manual harvesting with few currently viable automated alternatives. 7 For NSW horticulture industries, the most vulnerable to labour shortages include blueberries, table grapes and citrus fruits. 102
Following the price increases observed over the recent drought years, the consumer price index for vegetables remained almost unchanged over 2020-21, down 0.1% nationally year-on-year to June 2021 and increased marginally by 0.5% in Sydney. In contrast over the same 12-month period to June 2021, the consumer price index for fruit increased by 6.0% nationally and by 4.4% in Sydney. 19 Along with the lingering impacts of the drought on many perennial fruit crops, the greater dependency on casual labour for fruit harvesting compared to vegetable production likely contributed to the higher consumer prices for fruit in 2020-21.
The value of horticultural exports decreased in 2020-21 to total $288.3 million, 38% lower than in 2019-20. Disruptions to international trade created by the Covid-19 pandemic contributed to this outcome. Large decreases in the value of exports to principal markets included China accounting for horticultural exports of $58.7 million in 2020-21, 54% lower year-on-year; Japan $35.6 million, a decrease of 30%; Vietnam 79% lower to $6 million; and the United States decreasing 56% from 2019-20 to total $11.1 million in 2020-21. The value of exports to Hong Kong totalling $23.3 million in 2020-21 was 2% higher over 2019-20. For comparison, national exports of horticultural products in 2020-21 were also lower year-on-year, decreasing 12%. 128
Nuts
Nut production for 2019-20 increased to 48,354 tonnes
t
across the seven main types of nuts produced in New South Wales, an 11% increase year-on-year.
131
132
Increased production was driven by recent tree plantings reaching bearing age and production maturity, with almond production experiencing growth of 7% year-on-year and macadamia production increasing 5% year-on-year in 2019-20. Other tree nut crops also increased in production with walnuts increasing 28% producing 10,227 tonnes (in-shell weight equivalent) and pistachio and pecan crops increased by 56% and 20% respectively, albeit from smaller production bases in 2019-20.
131
132
Tree nut production was valued at $262.7 million in 2019-20, with the value of almond production of $110.3 million, macadamia production of $99.8 million.
17
Exports of nuts in 2020-21 were valued at $86.8 million, a 63% decrease on the previous year. The major export destinations by value included China with exports valued at $25.4 million and Japan $22.2 million, representing 29% and 26% of the share of total nut exports by value respectively. 128 Exports were impacted by the Covid-19 pandemic causing supply chain disruptions, and changes in consumer purchasing patterns, with snack products decreasing as a result of travel, hospitality and leisure restrictions globally. 33 141
Macadamia production in NSW has remained flat with production decreasing marginally by 3% between 2016-17 and 2019-20 131 , while greenfield plantings in recent years has increased potential production in the Richmond and Clarence Valley regions of NSW. 32 The average tree age in Northern Rivers and Mid North Coast regions in 2019 was 24 years and 20 years respectively, compared to the average tree age nationally of 19 years. 168 An estimated one third of trees planted nationally are yet to reach full production. 32
Macadamia production in NSW has remained flat with production decreasing marginally by 3% between 2016-17 and 2019-20 131 , while a surge in greenfield plantings in recent years has increased potential production in the Richmond and Clarence Valley regions of NSW. 32 The average tree age in Northern Rivers region and Mid North Coast region of NSW was 24 years and 20 years respectively compared to the average tree age nationally of 19 years. 168 An estimated one third of trees planted nationally are yet to reach full production. 32
Global macadamia production was 60,057 metric tonnes (kernel weight equivalent) in 2019-20, with South Africa responsible for 29% share of production followed by Australia with 22% share. Average annual growth over a ten-year period to 2019-20 was 3,459 tonnes per year. 140 Sustained supply growth may provide further opportunities for the use of macadamia products in food ingredients markets. Currently an estimated 30% of Australian kernel usage is directed to ingredients markets while the majority share by volume is used in snack markets with the remainder utilised in food service. 32
NSW almond production was 26,664 tonnes (kernel weight equivalent) in 2019-20 a 7% increase year-on-year, and represented 25% of national production. 132 NSW plantings of 5.33 million trees accounted for 35% of the national tree inventory in 2019-20 with production valued at $110.2m in 2019-20. 1 17 Production continues to grow as previous tree plantings reach bearing age and tree maturity.
NSW almond exports increased 13% in quantity terms but decreased 35% in value terms. Nationally, almond exports were valued at $545 million in 2020-21, down 16% due to Covid-19 disruptions to trade, while in volume terms exports increased 30% to 96,400 tonnes year-on-year. China and India remain the major export destinations for Australian almonds accounting for 39% and 17% of the share by value in 2020-21. 128
Growth in tree nut production by weight t u
- NSW 2016-17
- NSW 2019-20
Source:
HIA (2018)
,
HIA (2020)
KWE = Kernel Weight Equivalent, ISWE = In-Shell Weight Equivalent
Tonnes values are Kernel Weight Equivalent (KWE)
Global Almond Outlook
World production and consumption of almonds
- United States
- European Union
- Australia
- China
- Turkey
- Other
- Consumption
Source:
USDA (2018)
,
USDA (2020)
,
INC (2021)
The global outlook for almonds reflects continued increases in production, and in the medium-term, increasing demand. Almond production reached an estimated 1.73 million tonnes (kernel basis) in 2020-21 following production increases in the United States, Spain, and Australia. United States production alone is estimated to have accounted for 82% of global production, producing a total of 1.38 million tonnes in 2020-21. Coinciding with a record United States crop in 2020, market access disruptions and subdued demand for some almond products, a consequence of the Covid-19 pandemic, resulted in almond prices decreasing by 13% over 2020.
182
The outlook for global supply is to increase by 3% in 2021-22, however severe drought conditions in California may limit production in the United States. At the same time, global demand for almonds is anticipated to increase by 12% in 2021-22 year as the Covid-19 pandemic impacts on markets recede. 141 Continued consumer interest in the perceived health benefits of almond products in snacks, ingredients, and in dairy substitutes, is expected to support demand. 141
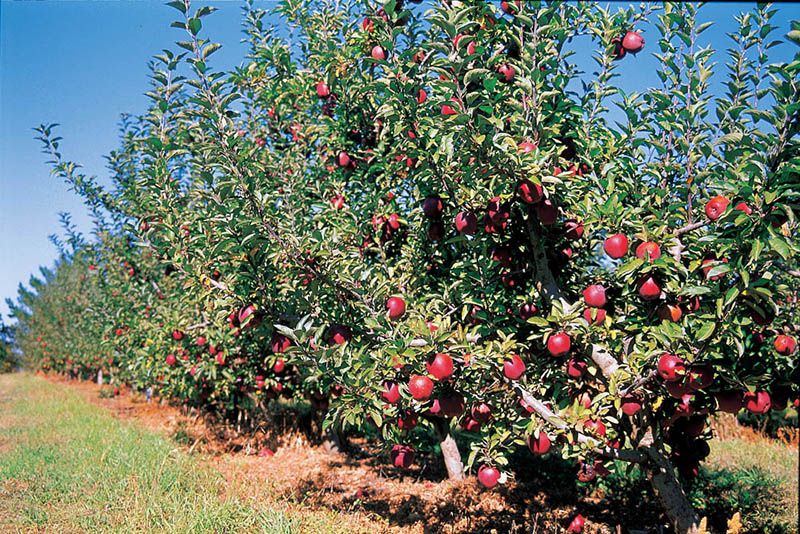
Fruit
Fruit production in 2019-20 totalled 424,597 tonnes, 9% lower than the volume produced in 2018-19. This decrease in production was in part a consequence of the recent drought’s impact on perennial fruit crops; orange production for example, decreased by 3% year-on-year to total 260,555 tonnes in 2019-20. Similarly, apple production decreased 3% from 2018-19, and avocados 24% lower, with production totals of 41,222 tonnes and 9,137 tonnes respectively in 2019-20.
131
132
Exports of fruit by value were down 11% year-on-year in 2020-21 to total $95.1 million, with East Asia and South East Asia countries accounting for 77% of these exports by value. Citrus exports, predominantly oranges, to China and Hong Kong totalled $13.8 and $6.3 million respectively in 2020-21, while citrus exports to Japan were valued at $7.9 million. These three markets represented 51% of citrus exports by value in 2020-21. Orange exports worth $48.3 million in 2020-21 were 8% lower than the 2019-20. 128
Berry production has the highest gross value of the fruits grown and predominantly supplies domestic markets. However, the industry is targeting exports, with the value of exports increasing 7% to $7.4 million in 2020-21 over 2019-20. 130 128 While the quantity exported for the year decreased by 20% to 530.5 tonnes over the 2019-20 year, the per unit price of exports increased by an average of 33% year-on year. The two major export markets for berries were Hong Kong, taking 63% of export by value, and Singapore accounting for 25% of exports by value for 2020-21. 128 In terms of export competition, berries such as blueberries are grown counter-seasonally in NSW for exporting to the northern hemisphere, however they do compete with South American countries such as Chile, Peru and Argentina in Asian markets. 118
Vegetables
Production of vegetables by volume decreased 6% in 2019-20 to total 375,817 tonnes, while the area committed to vegetable production decreased by 25% to 10,300 ha. The value of production was 14% lower over the previous year to total $427.2 million in 2019-20.
17
18
Continued impacts of drought conditions especially in the first half of 2019-20 and associated higher water prices, impacted production. While the Covid-19 pandemic in 2020 impacted vegetable products variably, as domestic consumer purchasing patterns altered demand for some products, and export market access effected others. For example, melon production in 2019-20 was limited by water availability and production decreased by 33% to 52,894 tonnes and 24% in value terms year-on year. In contrast, the value of broccoli production increased year-on-year by 128% in 2019-20 to $9.7 million.
132
17
This increase in value was driven by drought restricted supplies coinciding with increased demand from consumers for fresh vegetables during the Covid-19 pandemic, resulting in increased wholesale prices by over 70% at times through 2019-20.
133
180
Vegetable exports totalled $33.6 million in 2020-21, a 3% increase over the previous year. Major export destinations included Singapore, South Korea, Hong Kong and the United States. Melon exports decreased by 33% to 2,316 tonnes in 2020-21 compared to 2019-20, however the value of exports decreased by a smaller 26% year-on-year to $5.4 million, a result of an 11% increase in the average export price per unit. Singapore remained the major destination taking 49% of total melon exports by volume and 43% by value, while exports to the United Arab Emirates represented 26% by value and volume. Potato exports to South Korea totalled $6.4 million, representing 78% of the total value of potato exports. 128
Nurseries, Turf and Cut Flowers
Nursery production for 2019-20 in gross value terms increased 19% to $396.9 million over the previous year, across 407 businesses.
17
18
The area estimated to be used for nursery production was 1,347 ha with 208 ha under cover.
18
While the industry has grown consistently in value terms in recent years, the large increase in 2019-20 is attributed to changing consumer behaviour as a result of the Covid-19 pandemic, with increased consumer demand for garden plants and indoor plants and herbs for their homes.
126
The value of turf production was estimated at $115 million in 2019-20, a 9% decrease on the prior year, produced from 2,089 hectares, a 10% reduction in the area used for turf production in 2018-19. 17 18 In 2019-20 the amount of turf produced in NSW was estimated at 11.7 million square metres, a 3% decrease from 2018-19. 131 132 With drought conditions generally easing over eastern Australia in 2020, watering restrictions in many residential regions have eased resulting in increased demand for turf. 201 Demand has also been influenced by the Covid -19 pandemic which has been attributed with increased interest in consumers undertaking home improvements. 201

However, flooding that occurred in early 2021 in the Sydney Basin has had substantial short- term impacts on the NSW turf industry, given that 71% of the state's turf farming by area and 60% of turf farm businesses are located on the floodplains in the Sydney Basin.
18
The medium-term outlook for turf, is anticipated to be positive with demand supported by dwelling commencements and improving consumer confidence, while competition from synthetic products along with limited demand from high density housing developments will remain moderating factors.
134
Cut flower production totalled $27.6 million in 2019-20, a substantial 57% decrease on the previous year compared to a national decline of only 11%. Consistent with the decrease in the value of production, the area used for cut flower production decreased by 61% from 2018-19 to 609 ha. This decrease in production occurred for both undercover production systems, down 43% in area to 62 ha, and outdoor production which was 62% lower to 547 ha, compared to 2018-19. 17 18 Producers continue to adjust to flower imports, as well as to changes in the cut flower value chain, including a shift by consumers to supermarket purchasing of flower bunches, and growing demand from online flower retail stores. Producers have focussed on highlighting Australian origin flowers to consumers, while some producers have adapted their business by growing various varieties on their farms while also importing these same varieties out of season, to maintain consistent supply to customers. 135 107
Imports of cut flowers totalled $35.5 million in 2020-21, a 29% increase over the previous year, this is despite disrupted international transport, a consequence of the pandemic. 128 135 Imports in 2020-21 were derived principally from China, which represented a 38% share of imports by value, a 257% increase over 2019-20. Other major countries by share of the value of imports included Colombia 19%, Kenya 16% and Ecuador with 13% in 2020-21. 128 Low labour costs in these countries has provided a competitive advantage compared to domestic production. 107 At the same time, exports of cut flowers remains a minor market for NSW growers and was valued at A$0.15 million in 2020-21, with Japan the dominant destination. 128
Outlook
Continuing increased demand for fruit and vegetables domestically as well as in key export markets will support growth in the value of horticultural industries.
7
There is evidence that consumer interest in healthy food choices, including fresh fruit and vegetables, have been reinforced by the Covid-19 pandemic.
51
133
As economies and trade re-open, horticultural industries will benefit from the continued growth in demand, with evidence of improved trade condition for key crops such as macadamia nuts following the Covid-19 pandemic disruptions.
33
In terms of supply, increased water availability in irrigation areas provides further security for horticultural producers and supports a positive outlook for increased horticultural production in the year ahead. Aside from seasonal conditions, growth in horticultural production will also be particularly dependent upon improved access to seasonal labour and supply chain functioning for trade coming out of the global pandemic setting.
