

livestock
Milk
- Output $659 million est. Up 2% yoy.
- Competition for supply continued to support farmgate prices.
- Production was largely stagnant despite favourable seasonal conditions.
NSW Dairy Farm Monitoring Project
It allows farmers to compare their performance against other farms and identify areas for improvement. DFMP is a joint initiative between the NSW Department of Primary Industries and Dairy Australia.
The NSW Dairy Farm Monitor Project (DFMP) is highly valued by industry and participating (anonymous) dairy farmers. One benefit to farmers is an analysis of your farm business performance, presented to you in an individual farm report.
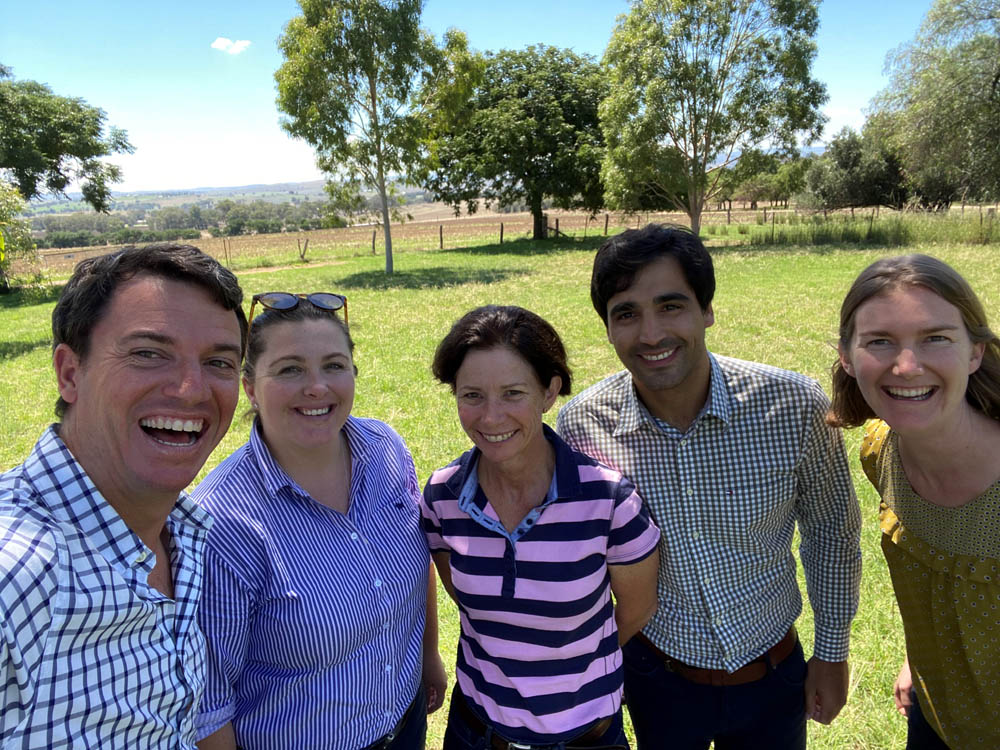
NSW DPI Dairy Team
The NSW DPI Dairy Unit is a great team with a huge amount of skills, knowledge & expertise that is absolutely committed to the sustainable growth of the NSW dairy industry, as well as providing sound advice to government and industry.
Production
When considering production and its effect on farmgate price, it is impossible to consider NSW production alone. NSW is a highly strategic region for the Australian dairy industry and in order to ensure adequate raw milk supply during times of high demand or low regional production, dairy processors will source and transport raw milk across state borders along the Australian eastern seaboard. Victorian milk production followed a similar trend to that of NSW, achieving a minor increase in production of 0.4% year-on-year, with the eastern region actually experiencing a decline of 1.5%. 65 Combined with a fall in production from Queensland, the Australian eastern seaboard milk pool experienced a seasonal increase in production of only 0.5% in 2020-21 to 7,031 million litres. Despite supportive feed availability and costs, the modest increase in raw milk production was linked to persistent high beef prices and several lingering impacts of the three-year drought including farm exits (encouraged by high land values), labour shortages due to COVID-19 restrictions, and a smaller dairy herd. The high cattle prices impacted farmers with herd rebuilding intentions, with many having to rely on growing their own replacements and delaying a return to full production. 66
The strong seasonal conditions provided a long-awaited benefit for most dairy producers, however it did create some challenges. Floods in the dairying regions of Northern NSW and Southern Queensland resulted in some cow losses and put further pressure on milk supply. Very wet weather over the summer months in Southern NSW, Northern and South-Western Victoria, impacted the quality of some pastures and reduced per cow milk yields. In addition, mild temperatures and wet conditions prolonged pasture growth and many producers took advantage of the substantial pasture reserves to reduce supplementary feeding, which also had an effect on per-cow production. 67
Price
Despite ongoing industry challenges related to the COVID-19 outbreak and static global prices at the commencement of the 2020-21 season, domestic processors were encouraged to maintain competitive prices in order to continue to secure supply and maintain factory efficiency. Whilst opening prices on-average were generally lower than the previous year, spare processing capacity meant that competition for milk remained strong. The weighted average farmgate milk price ended the year flat year on year which was 11% above the five-year average.
Despite a forecast for weaker commodity values at the start of the season, processers were prompted by rising global dairy prices in early 2021 to offer small autumn price step-ups of approximately 10 cents per kilogram milk solids to reach a weighted average farmgate milk price for the 2020-21 season of $8.53 per kilogram milk solids. 68 The figure below charts the Australian Commodity Milk Value e 161 against the NSW weighted average farmgate price. This illustrates the influence of the global market on farmgate price and also highlights the additional value captured by value-added dairy products and/or the premium due to processor competition for raw milk. 160
Average Australian Commodity Milk Value and NSW weighted average farmgate price e
- CMV
Trade
China was once again NSW's top trading partner with the value of exports to China increasing by a massive 142% year-on-year. 128 The surge in Chinese import demand covered a broad range of dairy products, notably fluid milk, milk powders, whey and whey products. With regards to liquid milk, historically low per capita consumption in China is being driven upwards by high levels of private and public investment in the sector and government messaging around the health benefits of fresh milk. 172 Whey exports benefitted from the rebuilding of the Chinese pig herd with whey protein concentrate an important ingredient in piglet feed formulas because it is highly digestible and palatable.
Macroeconomic Conditions
Global dairy prices, as measured by the FAO Dairy Price Index, averaged 110.4 points in 2020-21 103 , up 10 points year-on-year and primarily reflecting increased import demand as economies began to recover from the initial COVID-19 induced shutdowns, with China’s import demand playing a central role. Global demand rose faster than supply which caused commodity prices to surge, with all major commodities traded above 2019-20 levels.
Outlook
Dairy processors and milk buyers announced opening domestic farmgate prices for the 2021-22 year in June 2021 and several step-ups were announced over the weeks following, reflecting the ongoing intense competition for supply. Initial prices for the Southern Milk Pool averaged $6.92 per kilogram milk solids, representing a 5% increase on 2020-21 opening prices and NSW liquid milk prices averaged 66 cents per litre (approximately $9.17 per kilogram milk solids).
Global milk production is expected to stabilise which will mean that future price directions will be largely driven by demand. Overall, the global demand outlook looks favourable although there are some risks. Ongoing COVID outbreaks and lockdowns will mean that the rate of economic recovery and vaccine rollouts will vary by country, which will continue to have an ongoing effect on regional consumption patterns well into 2021-22.
