

Australian cotton exports were a standout in 2022-23 totalling $4.2 billion on exports of 1.28 million tonnes. This was almost double the $2.2 billion recorded in 2021-22 and 69% higher year-on-year in volume terms. 35 Global consumption of cotton is expected to lift in the year ahead with increased mill activity. Domestically, current water storages for NSW’s major river systems are supporting water availability for irrigators in 2023-24 and therefore the outlook for cotton production in the short term.
cropping
Cotton
- GVP $2.3 billion est. Down 24% year-on-year - second highest on record.
- Production down 12% to 3.2 million bales.
- Strong demand underpinned $4.2 billion in national cotton exports.
Gross value of cotton production in 2022-23 is estimated at $2.3 billion, and while this is 24% lower than the record achieved in 2021-22, it still represents the second highest annual value for the industry. Production is expected to be 3.2 million bales, 12% lower year on year with challenging wet conditions delaying sowing and harvesting and flooding especially in the southern growing regions of the state. Despite this, production is still well above the longer-term average of 2.1 million bales (10-year annual average to 2020-21).
1
Similarly cotton prices came off their peak achieved in 2021-22 with the international benchmark price index declining 35% in Australian dollar terms over the latest financial year, although Australian cash prices have remained above the medium-term average.
Production
Production is expected to be 3.2 million bales, 12% lower than the record 3.7 million bales achieved in 2021-22. However this production is still well above the longer-term average of 2.1 million bales (10-year annual average to 2020-21), and while estimated yield was estimated to have declined 13% year on year to an average of 7.84 bales/ha, total production remained supported by a record area harvested totalling 413 thousand ha in 2022-23.
1
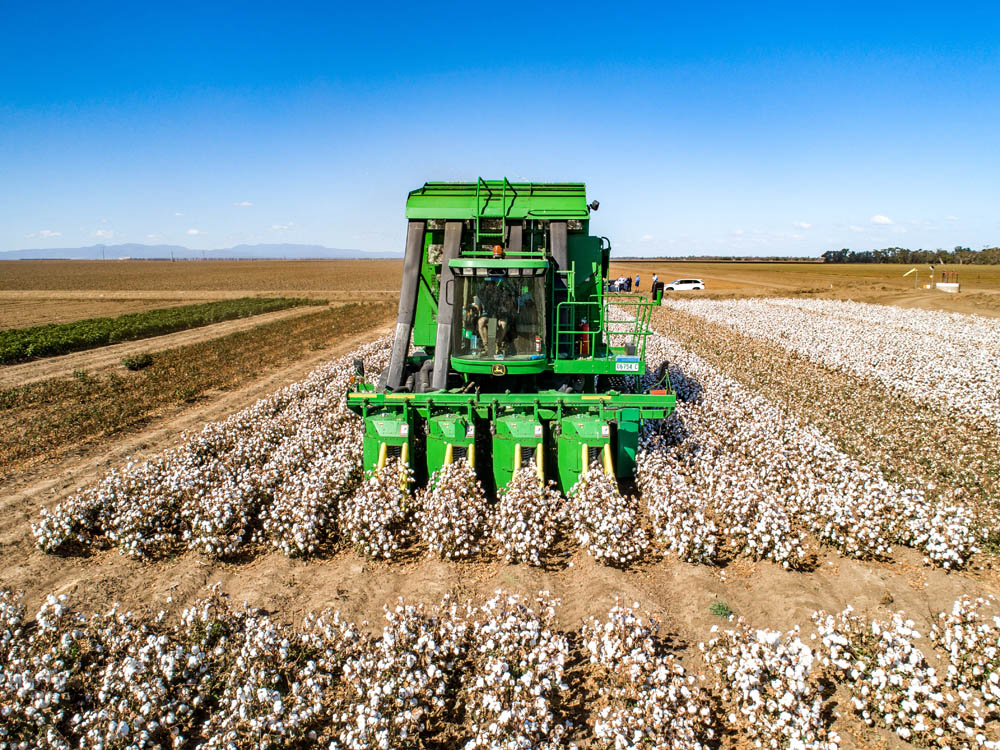
Cotton crops were challenged by wet conditions that delayed sowing and combined with milder growing temperatures, resulted in delayed harvesting for many NSW growers.
Flooding in the southern valleys, and the Macquarie Valley especially, resulted in a reduction in the area sown and in some cases, crops being lost before harvesting. In the case of southern valleys, estimated crop area was down 37% year on year and 25% lower for the Macquarie Valley.
147
148
For northern NSW, drier and warmer conditions assisted yields and quality for many crops, with relatively stable to modestly higher total production areas harvested in 2022-23 compared to the prior year. Notably, the crop area in the Gwydir Valley was an estimated 25% higher than in 2021-22.
147
148
149
Cotton production and yield 1
- NSW Production
- Rest of Australia Production
- NSW Yield (RHS)
- Rest of Australia Yield (RHS)
Regional production estimates 147 148 h
- 2021-22 Area
- 2022-23 Area
- 2021-22 Production (RHS)
- 2022-23 Production (RHS)
Price
Cotton prices internationally were volatile during 2021-22 and into 2022-23 with the international benchmark Cotlook A Index declining 35% in Australian dollar terms over the latest financial year, and by 43% from the price peak realised in May 2022.
150
Despite this Australian cash prices, which averaged $638 per bale over the second half of 2022-23, have remained above the prior two-year average to June 2021 of A$543 per bale.
152
Variable production from major producers during 2022 contributed to the price volatility with drought impacting United States crops. The United States experienced 19% lower production and 11% drop in export volumes in 2022-23 over the prior year, with the United States the largest cotton exporter. 153 Other factors contributing to the price volatility included earlier mill purchases following on from COVID pandemic re-opening of supply chains and subsequent inventory destocking by mills over 2022-23. 153 154
Australian and international benchmark cotton prices 150 152
- Cotlook A Index
- Cash Price
Cotton and synthetic textile price indexes 150 156 157 ai
- Spun cotton yarn
- Spun synthetic yarn
- Cotton A Index (RHS)
Synthetic yarn prices were similarly impacted by post pandemic market activity as well as oil price spikes over the last two years. Notably the spread between the synthetic yarn price index and the cotton yarn index increased during 2022-23 with the cotton index moving relatively higher.
Competition between synthetic yarn and natural fibres including cotton effectively places a ceiling on international cotton prices longer term. 155
Trade and Macroeconomic Conditions
Australian cotton exports increased significantly in 2022-23 over the prior year, totalling $4.9 billion on exports of 1.28 million tonnes. This was up from $2.2 billion recorded in 2021-22 and 69% higher year-on-year in volume terms.
35
Exports to Australia’s largest destination Vietnam represented 40% of export share by value and volume in 2023, with the value of exports more than doubling to $1.96 billion and 68% higher volume terms. Pakistan, Australia’s fourth largest cotton importer, saw Australian exports reach 90 thousand tonnes in 2022-23 which was up from 26 thousand tonnes the prior year. 35 This increase was partly attributed to Pakistan’s 35% reduction in domestic cotton production due to flooding in key growing provinces in 2022. 158
In contrast, exports to Indonesia were 9% lower year-on-year in volume terms, at 138 thousand tonnes. 35 The second largest market for Australian cotton in both total value and volume over the last two years, Indonesia has experienced a significant shift in total cotton consumption. Consumption decreased to a 30-year low in 2022-23, with total Indonesian imports of 348 thousand tonnes, 38% lower year-on-year. 153 Domestic cotton consumption in Indonesia has been impacted by reduced tourism following the COVID epidemic, at the same time domestic consumers have tended to substitute cotton with lower priced domestically produced synthetic apparel. Additionally, about 40% of Indonesian consumption is utilised in yarn manufacturing for export, especially to China. Indonesian cotton yarn exports were less than half the 5-year average between March 2022 to April 2023. 159
Australian Cotton Exports by Value 35
- Vietnam
- Indonesia
- India
- Bangladesh
- Pakistan
- Thailand
- RoW
Global cotton production, use and ending stocks 160
- Production
- Mill use
- Ending stocks
- Stocks to Use Ratio (RHS)
High cotton prices and increased yarn and fabric inventories over the last two years resulted in a decline in global mill use in 2022-23 which, excluding 2019-20 when the COVID-19 pandemic began, was at the lowest level since 2013-14, and is reflected in increased cotton stocks relative to use in 2022-23.
160
Outlook
Following the lower mill use of cotton in 2022-23 global consumption is expected to lift in the year ahead. However, demand for cotton is significantly dependent upon prevailing economic conditions which can impact consumer sentiment, with cotton products and apparel typically considered more discretionary in nature. Demand for Australia’s high-quality cotton will also benefit from the global outlook for cotton in the 2023/24 year which at this stage is expected to reflect slightly lower global stocks due to increasing consumption from mills, and a marginal decline in production attributed to a lower production forecast for China in 2023, the largest cotton-producing country.
153
Exports of Australia’s high-quality cotton will also potentially benefit in the longer term from the recently signed Australia-India Economic Cooperation and Trade Agreement, which includes Australian access to a 300,000-bale duty-free quota from 2023. 164 For context, Australian cotton exports to India totalled 111 thousand tonnes which is equivalent to 489,000 bales in 2022-23.
The initial outlook water storages for NSW’s major river valleys and systems appear supportive for cotton production in 2023-24. Most irrigation schemes are at or near full capacity, supporting current generally higher General Security water allocations. 161 However seasonal conditions such as the development of an El Niño in 2023-24 163 are expected to influence the ultimate allocation of General Security water for cotton irrigators, while drying soil profiles reported in the north west of NSW may limit opportunities for dryland sowing of cotton in the region. 59
Stronger Primary Industries Strategy
Benchmarking water productivity of Australian irrigated cotton
Strategic Outcome

Sustainable Resources and Productive Landscapes
- 6.1 Assess and monitor natural resource health for sustainability
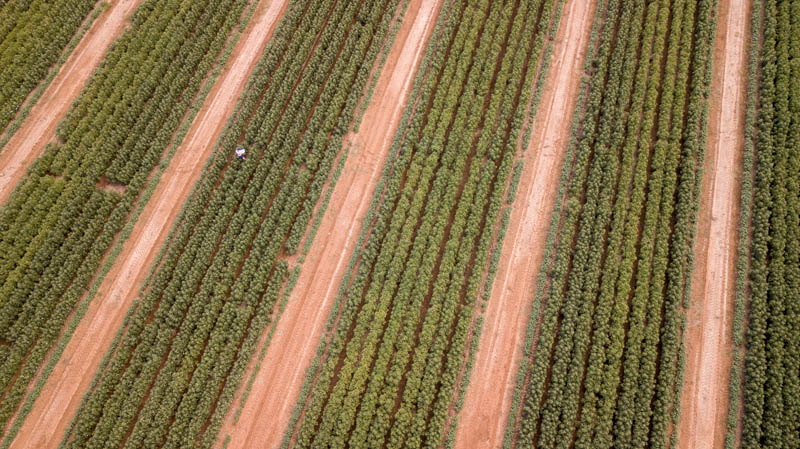
Improving water productivity is a high priority for Australian agriculture, especially given increased pressure on available water supplies. NSW Department Primary Industries (DPI) is working with the Australian cotton industry to improve the productive and sustainable use of irrigation water. NSW DPI, in partnership with the Cotton Research and Development Corporation, has been assessing the trend in water productivity of irrigated cotton since the 1990s.
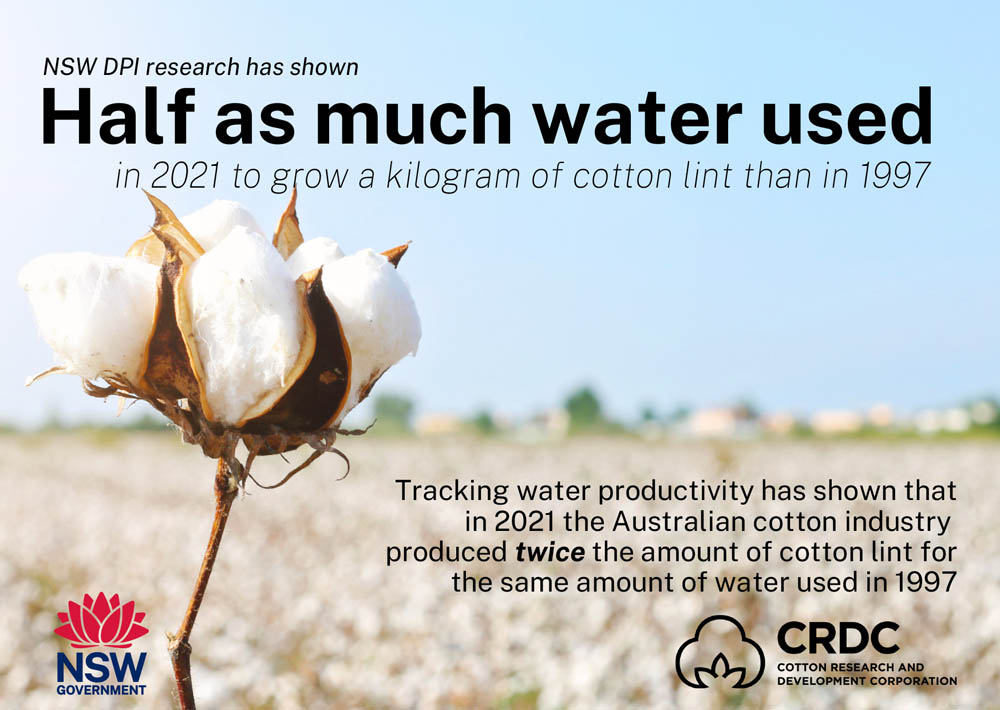
NSW DPI Agriculture research has shown half as much water was used in 2021 to grow a kilogram of cotton lint than in 1997. The amount of water used in 1997 actually produces double the amount of cotton. Water productivity measures the weight of cotton lint produced per unit of water used to grow it. Improved water productivity and water sustainability are driven by increased yield and reduced water consumption, during a period when rainfall is declining.
This NSW DPI research is rooted to the experience of growers on the ground. Grower records of water were used to estimate the water balance for each farm, capturing all water inputs and outputs. This data was used to calculate water productivity and water sustainability indices, and irrigation efficiency metrics, as well as to identify where and how much irrigation water is lost, in the irrigated farming system.
NSW DPI will continue to work closely with the cotton industry to support the drive in production and maximise opportunities for the future.
