

International factors including the war in Ukraine, short supply of higher grade east coast wheat and tightening global wheat stocks ensured that wheat prices remained elevated. International demand also boomed for NSW wheat, with exports reaching new record levels of approximately $3.3 billion, 13% higher than the previous record set last year. NSW remained extremely competitive in Asian export destinations, with the region making up five of NSW top six export market destinations in 2023-24. To make way for these markets, exports to Italy declined sharply, but mainly on lower supply of export grade durum wheat varieties from North West NSW owing to unfavorable seasonal conditions.
cropping
Wheat
- GVP $3.6 billion est. Down 7% year-on-year.
- Local prices have mostly returned to parity with international indicators.
- Exports valued at a record $3.3 billion.
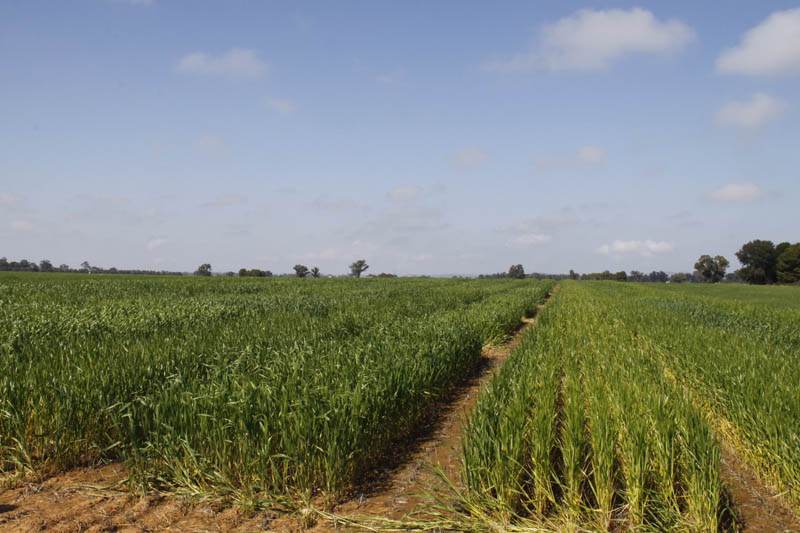
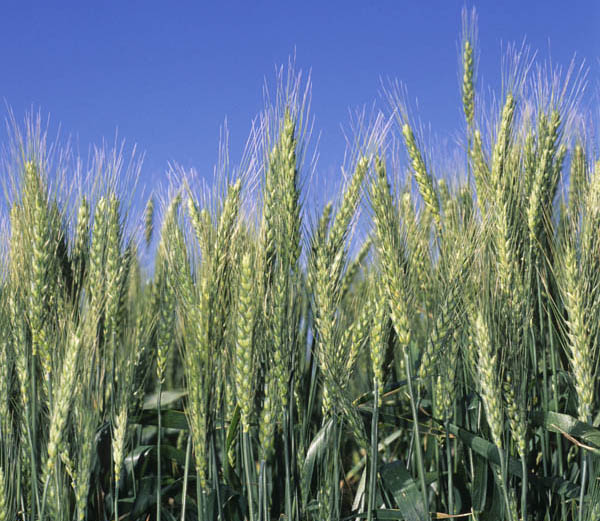
A difficult harvest for NSW wheat growers resulted in a delayed harvest with lower overall crop quality, however above average wheat production paired with elevated prices resulted in the second highest value wheat crop on record at an estimated $3.6 billion.
Production
Sowing began with root zone soil moisture ranging from average in pockets of the Riverina, Murray and North West through to above average in the rest of the key NSW wheat growing regions.
129
Soil moisture was aided by above average rainfall in most parts of the state in May and June, followed by very much below average rainfall for many areas in July.
129
140
As a result, the season allowed for slightly above average area of wheat to be sown at 3.6 million hectares, down marginally year on year.
1
High input prices limited the expansion of crop area, with cropping cash costs estimated to be 9% higher per business than the previous record high of the year prior.
112
The drier reprieve during June and July was followed by four consecutive months of very much above average rainfall for the majority of the NSW grain belt. 140 These conditions led to widespread flooding in inland NSW and complete or partial crop losses for some crops on flood plains or adjacent to water ways. Yields were also impacted, with average yields estimated to be down 14% on the year prior, albeit still well above the long term average. 1 The cool and wet harvest also delayed harvest significantly, with the bulk of NSW crop being harvested from December and into January. 128 Overall production reached an estimated 10.26 million tonnes of wheat, making it one of only four years historically to exceed the 10 million tonne threshold in NSW. 1
Price
Wheat prices have spent the year trading within an elevated $400/tonne to $500/tonne range band, with the ongoing war between Russia and Ukraine being the overwhelming force driving grain markets.
121
122
Peak prices for the year of around $500/tonne for H2 grade wheat occurred just prior to the bulk of the harvest, before retreating to the mid $400/tonne mark for the peak harvest period.
121
122
The short October-November spike in prices was attributable to concerns at the time over the Black Sea Grain Initiative owing to an alleged drone attack on Russian vessels, which caused the market to factor in further supply disruptions.
123
Despite recent falls in H2 grade wheat prices to around the $400/tonne level, basis for H2 grades have narrowed to parity or reached price premium levels compared to international indicators, with the exception of Hard Red Winter (HRW) wheat futures due to the lingering drought conditions hampering parts of the US. 126 Adverse harvest weather conditions on the Australian east coast impacted crop quality, and as a result significant price divergence of $100/tonne or more between higher milling grades and AGP1 temporarily occurred, before prices began converging again in 2023. 122
H2 Delivered Sydney - Price Differentials 121 122
- H2 Syd to CME HRW Futures
- H2 Syd to CME SRW Futures
- H2 Syd to Russia Milling
- H2 Syd to EU Grade 1
Macroeconomic Conditions
Global wheat production is estimated to have reached record levels for a third consecutive year in a row at approximately 790 million tonnes, and remains finely balanced with total consumption at approximately 787 million tonnes.
124
With all factors taken into account, global ending stocks are expected to decline for the third year in a row by 1.6% to 268 million tonnes and reaching the lowest level since 2015-16. The tightening global stocks are also reflected in the stock to use ratio, which has also been declining from previous highs. Annual production increases in major exporting countries Australia, Canada and Russia were offset by significant declines in Ukraine and Argentina. While Russia’s production reached record levels of 92 million tonnes, Ukraine’s production issues were a result of the ongoing war with Russia, while dry conditions hampered production in Argentina respectively.
124
Despite being one of the most commonly produced and consumed global commodities, on average 84% exports of wheat originate from the top seven export countries.
124
This means net wheat import nations are extremely sensitive to supply disruptions from these major export locations. Global ending stocks from the top seven export destinations are expected to lift modestly year on year, however this is being driven by a huge lift in stocks from Russia and the EU offset by a decline in stocks for almost all other major exporting nations. Notably, the increased stocks are also notably being reflected in the current price differentials between Australian H2 and Russian Milling and EU Grade 1 wheat types, as these major export competitors are being priced more competitively to clear stock.
121
Global Stocks and Stocks to Use 124
- Top 7 Exporters - Ending Stocks
- ROW - Ending Stocks
- Global Stocks to Use (RHS)
Trade
Global trade of wheat has been influenced significantly by the war in Ukraine. Notably substantial quantities of wheat exports from Ukraine have shifted from prior key export markets of Egypt, Indonesia and Pakistan with a combined 39% market share prior to the war, to nearby markets of Turkey, Romania and Spain which had 47% market share following the invasion.
125
This has been influenced by stop-start sea blockades of Ukrainian wheat ports by Russia, which has displaced trade flows via the Black Sea the major Ukrainian trade route. This resulted in grain being diverted into overland transport routes to closer Ukrainian markets.
35
Lower wheat production was partially reflected by a 7% reduction in NSW export volumes, however despite this NSW wheat exports increased 13% to new record levels of $3.3 billion. 35 This was due to a substantial increase in export prices underpinned by the short supply of higher quality grade wheat, particularly from the eastern states. Markets also became more concentrated in 2022-23 with 79% of wheat export sent to our top six export markets versus 64% to the same markets over the 10 year average. 35 Notable market developments include a 56% increase in trade to the new number one market of China to $874 million, owing to grain security concerns resulting from the Russia’s invasion of Ukraine. This same factor was also responsible for displacing grain from traditional Black Sea grain markets, and as a result NSW exported $264 million worth of wheat to Iraq after an eight year market hiatus. 35 Offsetting these gains was a 64% reduction in wheat exports to Italy valued at $53.3 million in 2022-23, with seasonal conditions reducing the amount of exportable grade durum wheat which dominate NSW exports to this market.
On a 12-month rolling basis, the NSW export price to domestic port price differential reached 10-year highs, however the average differential recently declined substantially in the second half of the year. d
Key NSW Export Markets 35
- China
- Vietnam
- Philippines
- Korea, South
- Iraq
- Indonesia
- Other
Outlook
Domestically, wheat production in NSW is forecast to decline 35% to 6.6 million tonnes which if achieved, would be the first sub 10 million tonne wheat crop in four years.
1
The major drivers behind this forecast is a lower wheat planting, particularly in the North West and parts of the Central West of the state, combined with the Bureau of Meteorology’s confirmation of El Nino conditions , which has the potential to limit crop yields with drier conditions prevailing leading into harvest.
127
Conversely, areas that managed to get solid wheat stands are may yet achieve reasonable yields this year with substantial sub soil moisture in most regions and reasonable winter crop rainfall for many areas, provided sufficient spring rainfall is achieved.
The wheat market will continue to be influenced by the Russia-Ukraine war, with any further deterioration likely to influence sentiment for the wheat market. Particular attention will be placed on prospects of any revamp of the Black Sea Grain Initiative, which Russia exited from in July 2023 citing unmet demands to continue. The initiative remains in a state of flux and will unlikely be fully resolved independently of the broader war in Ukraine.
Global production is expected to increase again, with El Nino conditions being factored into a forecast lift in production in the US, Argentina, Canada and China, offset by a large reductions in production from Australia and Russia. Global ending stocks are also forecast to tighten for a fourth year in a row which should remain supportive of prices. 124
Stronger Primary Industries Strategy
Climate Change Research Strategy
Strategic Outcome

Carbon Neutrality and Climate Resilience
- 5.1 Expand options for cost effective emissions reductions or avoidance
Empowering farmers to build resilience and adapt to climate change
NSW primary industries sector operates in one of the most variable climates in the world. Australian farmers are resilient and adaptable – they are innovators on the frontline in the battle against climate change – but as the rate and severity of climate change is predicted to intensify, the challenges of droughts and floods, storms and bushfires, and pests and diseases will increase.
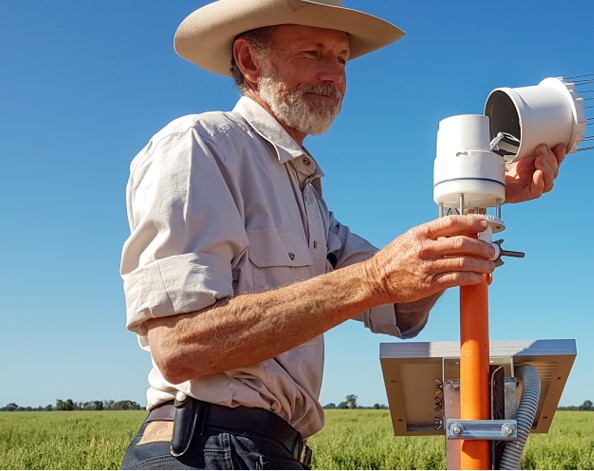
Climate projections indicate that areas of NSW will face decreasing winter and spring rainfall, increased intensity of extreme rainfall events, increasing day and night temperatures, fewer frosts, and harsher fire weather. As well as the challenges of a changing climate, energy security and energy affordability is also a concern for the sector. Whether it’s pumping water for irrigation, fuelling tractors and boats, or refrigerating packing sheds, energy is one of the biggest costs for many producers.
But there are also opportunities for the sector. A changing climate can provide untapped opportunities for new industries and for existing industries to expand into new areas of NSW. NSW DPI’s Climate Change Research Strategy is supporting farmers and growers as they navigate these challenges and opportunities. The strategy will ensure that an investment of more than $29.2 million in research and innovation will identify energy supply and demand solutions, carbon market and emission reduction opportunities, and climate resilience building programs, to help build resilience in the sector.
As part of the strategy, NSW DPI is conducting seven pilot projects in energy-intensive industries including dairy, horticulture and feedlots to show how innovative technologies and practices can improve on-farm energy efficiency, energy security and productivity, and reduce on-farm energy use, costs and emissions. The technologies include: solar thermal chilled water storage and control systems for milk cooling; electrification of irrigation pumps powered by an above ground solar photovoltaic tracking system to enable livestock grazing; solar photovoltaic and battery storage systems; electrification of LPG and diesel fuelled equipment; and peer-to-peer energy trading. Research results will help farmers better understand, manage and adapt to climate change. NSW DPI will use the results to develop future policies and programs for the long-term sustainability of the sector.
