

livestock
Wool
- GVP $1.1 billion est. Down 1% year-on-year.
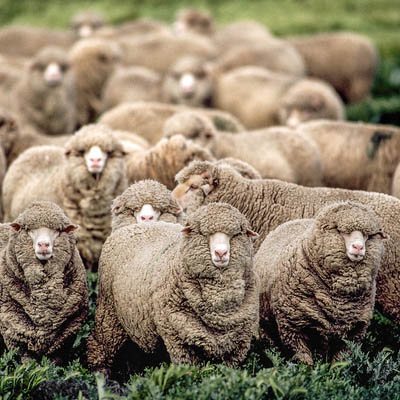
- NSW wool production is forecast to grow 5% year-on-year to 119 Mkg greasy.
- Slower global economic growth forced a downturn in global downstream spending on textiles.
Production
Wool Statistical Area Micron Split 2022-23 132
- New South Wales
- Victoria
- Queensland
- South Australia
- Western Australia
- Tasmania
The prolonged wet winter and spring also presented shearing challenges, with wet sheep causing delays that exacerbated existing labour shortages and created wool logistical interruptions between the farmgate and broker stores. National AWTA test volumes were lower than expected during late 2022 however, picked up pace again during the typical seasonal supply surge in early 2023, as growers worked through the shearing backlog. Overall, wool testing volumes were up 3.9% year-on-year in response to the increase in shorn sheep numbers. 131
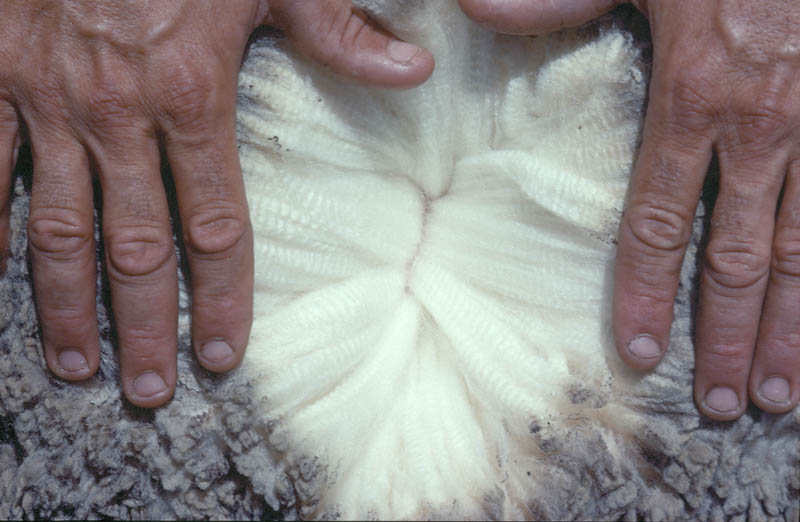
Average key wool test parameters were very similar to last season. Mean fibre diameter remained steady at 20.4µm, staple length increased slightly to 86.1mm, reflecting the good seasonal conditions and delays in shearing, and the average state yield was 67.7%, the highest level since 2000-01. 131 The micron profile of the Australian wool clip has two distinct peaks, one centred around 19-micron wool (finer than 16.6 microns up to 23 microns) and a second centred around 27 - 28 microns. 132
Price
For the first six months of the year to the end of December 2022, the market was reasonably steady, with the EMI largely tracking sideways. After an early seasonal rally, prices finally succumbed to lower Chinese demand. Prices stabilised in early 2023, as China made moves to ease some of its COVID zero policies however, the large end-of-year domestic offering and a weaker economic outlook resulted in the market closing the year in a further downward direction, recording losses for the last eight consecutive selling series of the year. 132
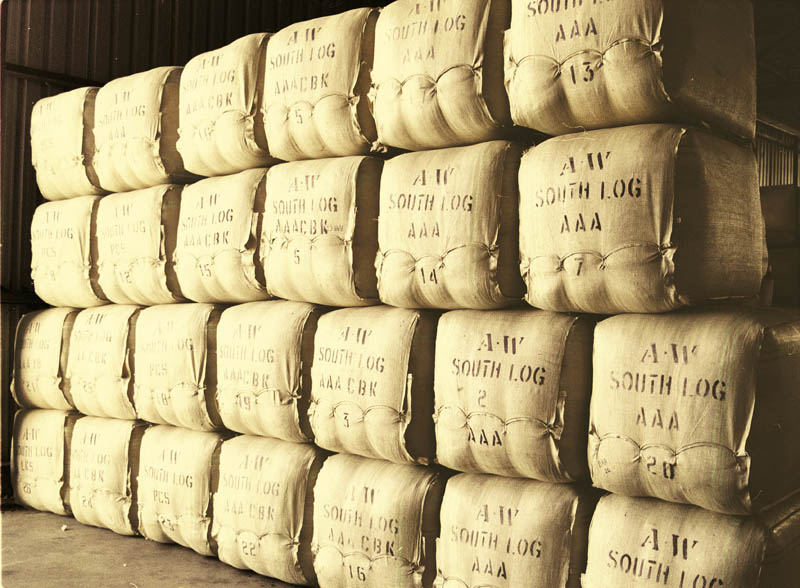
The AWEX NSW auction statistics for the 2022-23 season indicated a 1% increase in the volume of first-hand Merino wool offered across NSW, and a 7.3% increase in first-hand Crossbred wool offered. The total national value of the wool sold was $2.438 billion (an average of $1,517 per bale) 137 Despite the increase in shorn wool production at both a NSW state and at a national level, the total number of bales offered at auction nationally for the season was largely unchanged year-on-year. 137
Macroeconomic Conditions and Trade
The International Wool Textile Association (IWTO) noted that the prices of the major fibres which compete with wool, particularly cotton, which had been materially higher in the first half of 2022, fell back in the second half of the year following the same pattern seen for wool. 138 Unlike most fibre prices, polyester and polyamide prices finished 2022 above the levels of a year earlier. Cashmere prices, a major luxury animal fibre which competes with superfine wool, recorded a significant year-on-year decline in 2022. As a result of the divergent trends in prices between wool and its competitors, wool’s price competitiveness with the major competing synthetic fibres improved a little in 2022, particularly against polyester and polyamide. 138
Despite some headwinds, NSW wool exports continued to grow in both volume and value during 2022-23, boosted by the increase in shorn wool
China remained the largest single buyer with NSW wool exports increasing year-on-year in both value (up 1%) and volume (up 7%). 35 Trade was affected by the country’s COVID-19 shutdowns during late 2022 and a weaker-than-expected economic recovery once restrictions eased in early 2023. China's market share decreased marginally during 2022-23 to a total of 83% by volume and 79% by value, 35 with India and Italy both increasing their respective market shares.
From 2023, the flow of wool exports to India showed a dramatic increase under the newly agreed Australia-India Economic Cooperation and Trade Agreement (India-Aus ECTA). 134 Under the agreement, import tariffs on Australian greasy wool were eliminated on 29 December 2022. Whilst India has always been among the top three importers of Australian wool, on average, taking 2-3% of the national clip annually, 35 it is hoped that the ratification of the ECTA might spark greater buyer interest. India is well-known for its premium textile manufacturing, ranking just behind China as the world's second-largest manufacturer of textiles and garments and contributes to 14% of its export earnings annually. 135
Outlook
The supply of NSW greasy wool is forecast to continue to grow over the short term due to the positive impact of good seasonal conditions on wool yield and modest growth in sheep numbers. NSW shorn wool production is forecast to increase 3.9% to 123.6Mkg greasy during 2023-24. 130 . The announcement of an El Nino event and a positive Indian Ocean Dipole (IOD) and the increased probability of warmer and drier conditions means that many producers may be increasingly cautious of carrying excess stock which may impact supply over the medium term.
Stronger Primary Industries Strategy
New fishing rules for Mulloway
Strategic Outcome

- 6.1 Assess and monitor natural resource health for sustainability
- 6.2 Govern natural resource use through modern policy and frameworks
- 6.4 Improve the quality of the natural resource base
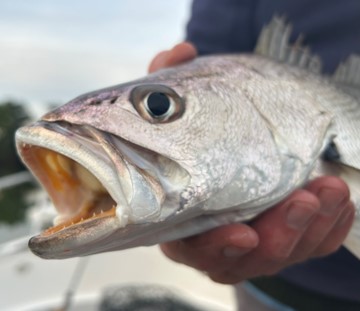
New Interim Fishing Management arrangements for Mulloway help with stock recovery
In September 2023, the NSW Government announced new management arrangements to Mulloway are now in place to reduce fishing mortality by commercial and recreational fishers and charter boat operators in an effort to protect and rebuild the Mulloway population in NSW. Mulloway are an important and iconic species for NSW commercial, recreational and Aboriginal cultural fishers, however stocks in NSW are currently classified as ‘depleted’, with the recreational and commercial fishing sectors each harvesting proportions of around 50% of the available Mulloway catch.
Recovering Mulloway stocks in NSW is a key priority for NSW DPI Fisheries, with fisheries managers working with key stakeholders to ensure the recovery of this species. A Mulloway Harvest Strategy Working Group was established back in 2021 to develop a forward-looking Harvest Strategy for Mulloway in NSW. The Harvest Strategy will continue to provide a strategic framework and decisions to promote stock recovery in the longer term. DPI Fisheries sought advice from the Mulloway Harvest Strategy Working Group and established advisory councils on additional interim measures to protect the depleted stock. These interim arrangements have been designed by DPI Fisheries, using the best available data, to achieve reductions in retained annual catch across all stakeholder groups. They include:
- Size limit: continuation of the 70 cm minimum legal length (all sectors);
- Bag and boat limit for recreational fishers: continuation of the daily bag limit of one Mulloway per person and a new boat limit of two Mulloway per boat per day;
- Boat limit for the charter sector: a new boat limit of three Mulloway per boat per day.
- Take and possession limits for commercial fishers: A new zero kilogram take and/or possession limit for endorsement holders in the Lobster and Southern Fish Trawl fisheries, and a new 200 kilogram daily take and/or possession limit for all other endorsement holders in the Estuary General, Ocean Trap and Line, Ocean Hauling and Ocean Trawl fisheries.
Previously there were no direct controls on commercial Mulloway catch, other than a 500-kilogram daily catch limit for the Ocean Haul Fishery, with the catch levels in all other sectors being managed by input controls such as gear and effort restrictions. The aim of these new interim measures is to provide greater protection to adult fish in order to support the recovery of the currently depleted Mulloway population, which will allow all stakeholders to enjoy sustainable access to the fishery into the future.
These are interim arrangements, pending the finalisation and implementation of the formal Harvest Strategy for Mulloway, which will involve new approaches to management of Mulloway catch and effort across all fishing sectors. The draft mulloway harvest strategy will be finalised by the Mulloway Harvest Strategy Working Group soon and this will provide a further opportunity for stakeholder consultation.
DPI Fisheries will continue to monitor the stock levels of Mulloway to ensure the effectiveness of the new management arrangements.
