

livestock
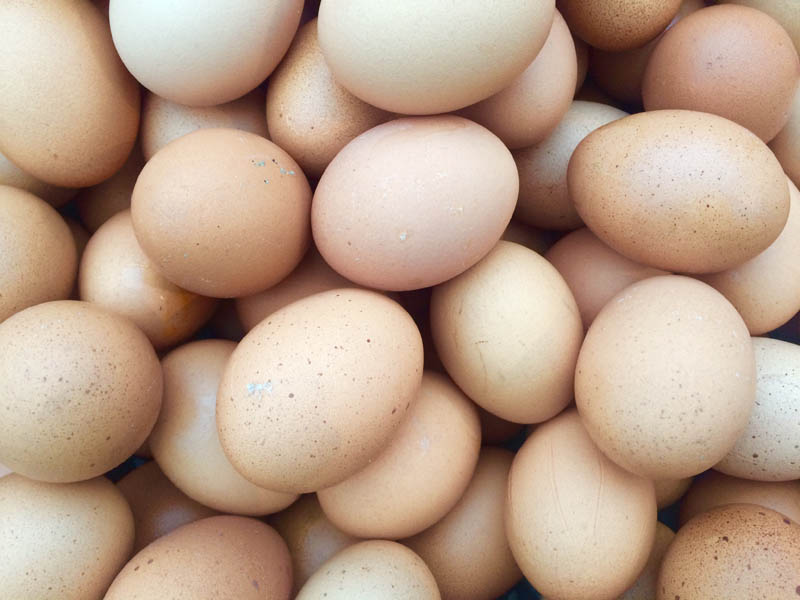
Eggs
- GVP $354 million est. Up 13% year-on-year.
- Nationally egg prices up 12% in 2022-23.
- Barn-laid eggs share of major grocery chains’ retail sale volumes increased to 15% in 2022-23, from 11% in 2021-22.
Production ag
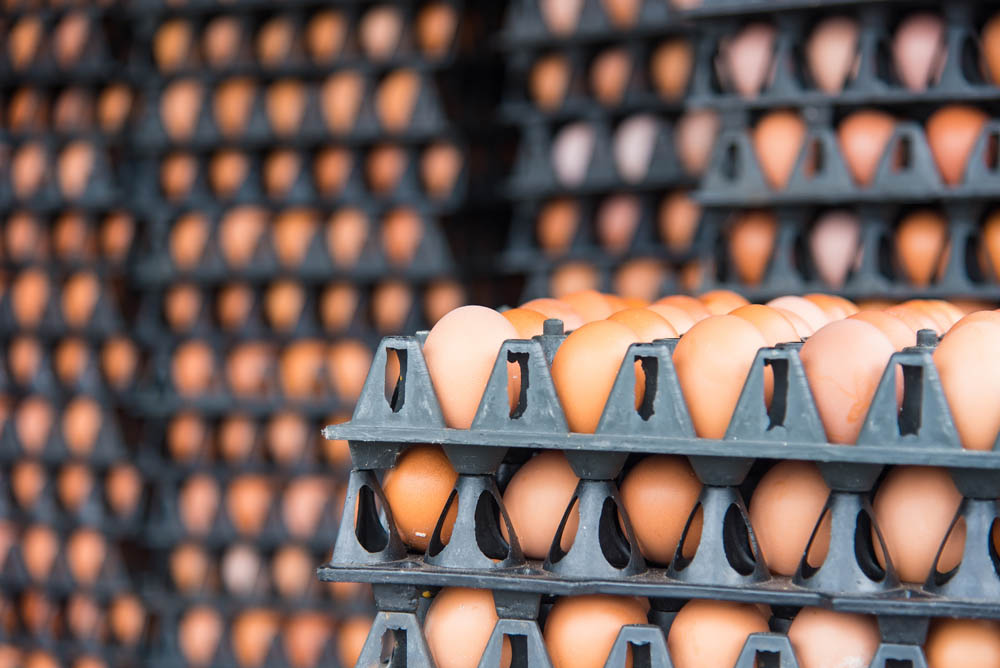
The trend towards non-caged eggs continued with the share of cage eggs sold through the major supermarket chains decreasing to 26% in volume terms in 2022-23 down from 31% share in the prior year. At the same time free-range eggs’ share lifted slightly to 57% in 2021-22, while the share in volume of barn produced eggs increased to 15% from 11% in the prior year. This increase in barn-laid eggs largely replaced the reduced cage egg share of the major grocery chains sale volumes. 186 Given eggs are seen as an important lower cost protein for consumers, this switch to barn-laid eggs as cage systems are replaced, is expected to continue given barn systems are typically higher productivity and lower cost than free-range systems. 61
Price
Average retail egg prices by production system 183 f
- Retail Cage
- Retail Free Range
- Retail Barn-Laid
Trade
Egg in-shell and not in-shell imports increased 20% in volume terms in 2022-23 and totalled $22.5 million, substantially higher than the $9.5 million reported in the prior year. This reflects the higher costs of egg and egg products globally in 2022-23 199 and the importing of higher value products. Imports from Netherlands represented about 50% of this total value of egg imports dominated by 'not in shell' processed egg products, and was valued at $11.7 million in 2022-23. 35
Globally, egg prices have increased and become more volatile in response to supply side constraints and increased demand. These supply challenges have included high feed costs, residual impacts of the COVID-19 restrictions that interrupted breeding systems for the supply of layer stocks, and ongoing outbreaks of highly pathogenic avian influenza in markets such as the United States, China, Europe and Southeast Asia and Japan. 199 200 At the same time global demand for eggs has increased due to cost of living pressures globally which has resulted in consumers substituting higher priced animal proteins with eggs. 199
Outlook
While recent price spikes for key inputs such as poultry feeds and energy costs have receded from record highs experienced during 2022 and into 2023, the outlook for production costs remains uncertain with ongoing geopolitical tensions threatening grain and oilseed and meal prices and energy costs. However industry has noted that consumer demand has stabilised, an important element in assisting industry plan future investments. 94
Stronger Primary Industries Strategy
Artificial intelligence pilot for food safety preparedness and licensing
Strategic Outcome

- 3.1 Prepare for and reduce the occurrence of food safety risks
- 3.2 Respond to and contain foodborne illnesses and food incidents
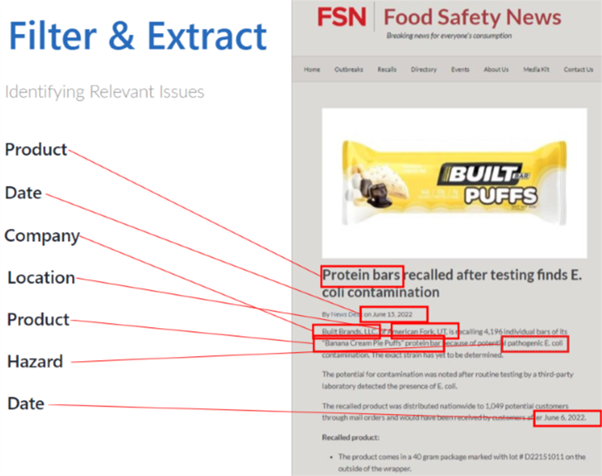
An example of the information filtered and extracted by the horizon scanning tool
The licensing tool allows NSW businesses to apply for, and receive their transport license in minutes via an assessment of photos of the condition of the vehicle. Additional functionality is being developed for NSW DPI to include licensing options for fishing vessels and game meat harvest vehicles. Other jurisdictions are developing AI tools to assist with automation of compliance inspections, which NSW DPI will be able to adopt when finalised.
The horizon scanning tool (Food-i) was developed in partnership with the Imported Foods Team from the Australian Government Department of Agriculture, Fisheries and Forestry, and Food Standards Australia New Zealand. The horizon scanning tool works by reviewing multiple sources of international notifications of food recalls, outbreaks, and rejected shipments of foods in real time. Information is filtered and extracted to assess potential threats and generate alerts, based on the type of hazard (e.g. Salmonella, undeclared allergen). The tool is able to generate automated alerts at a set frequency (e.g. daily, weekly, or more regularly) which are sent to nominated contacts and can be tracked to log whether each notification has been actioned.
Food-i can produce a report based on alerts over time, hazard, food category, and country. This makes the tool invaluable for conducting risk assessments and reviewing the risk ranking of food commodities. Further functionality will enable ‘predictive’ trend analysis of outbreak and recall notifications, and generate an alert where the frequency of a particular hazard or food commodity is above a specific background.
Additional functionality is also being developed to include alerts from domestic food safety hazards. This includes the use of customer focused websites and social media (such as Report Food Poisoning Now. Protect Others. (iwaspoisoned.com); or Google reviews) where illness may be linked to a restaurant or locally produced food, and linking this to reported complaints via the NSW Food Authority helpline, and increases in pathogens notified to NSW Health (such as Salmonella).
