August 2024
 Central West Local Land Services
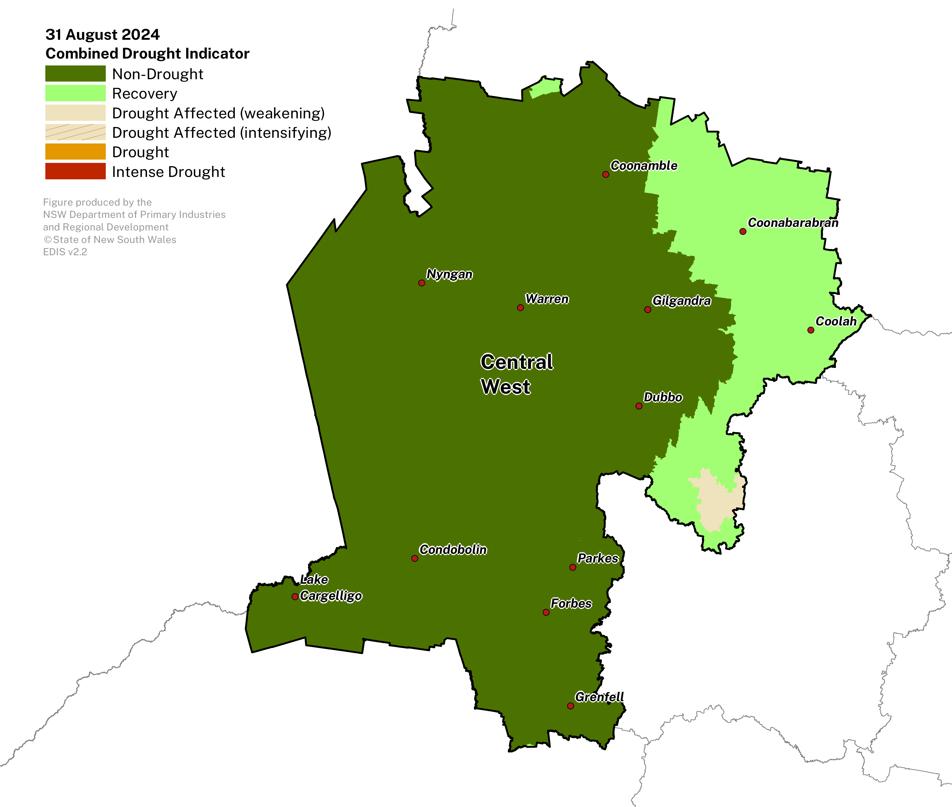
Conditions continue to improve across the region.
The Combined Drought Indicator (CDI) shows continued transition into the Recovery (17%) and Non-Drought (82%) categories at the end of August.
- Follow-up rainfall throughout August has seen conditions improve across the region, resulting in a further expansion of the Recovery and Non-Drought categories.
- On ground reports suggest wet conditions in some areas resulting in localised flooding and road closures.
- Producers are monitoring conditions closely as wetter conditions could potentially impact crop progress as the season progresses.
Click on the scroll bar below the map to compare with previous months.
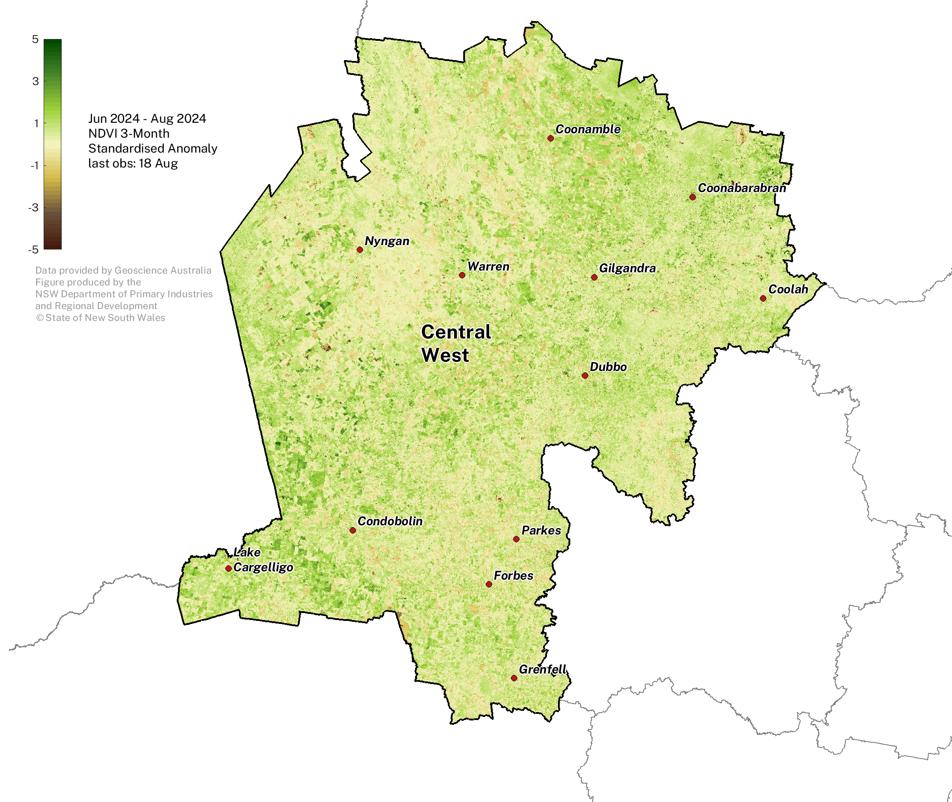
Normalised Difference Vegetation Index (NDVI)
Plant greenness levels remain above average for many parts of the region for the June to August period.
Note that some of the extremely negative NDVI areas (brown patches) are water bodies.
The NDVI anomaly is a useful measure of vegetation density and plant health. It estimates the amount of green vegetation there is in the landscape compared to what is expected at the given time of year, against the baseline period 1987 - 2020.
Click on the scroll bar below the map to compare with previous months.
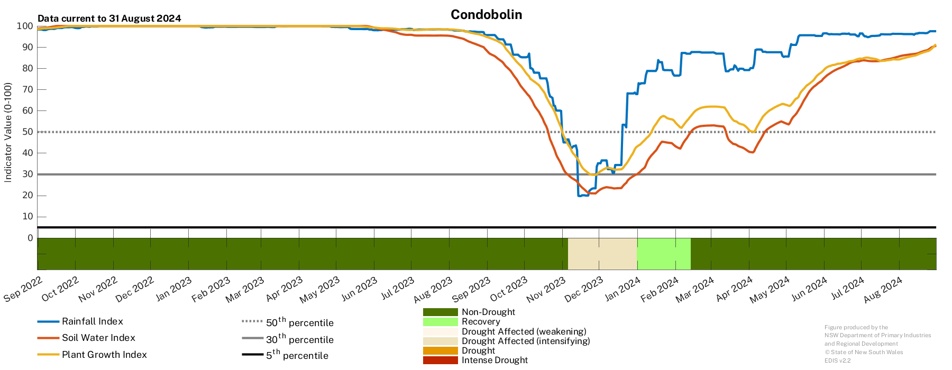
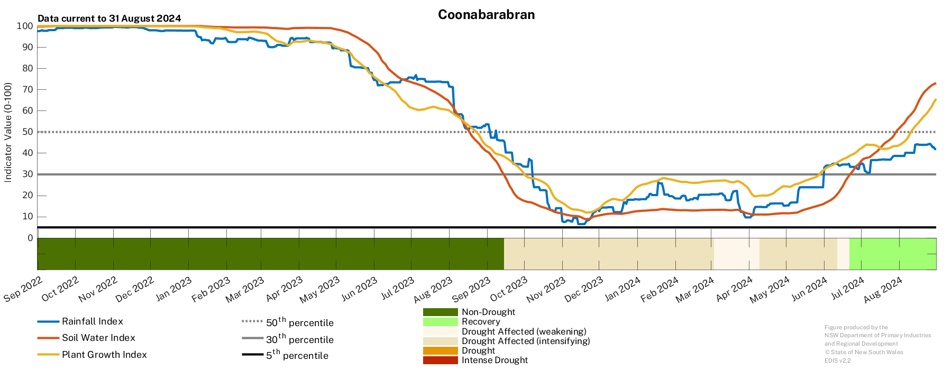
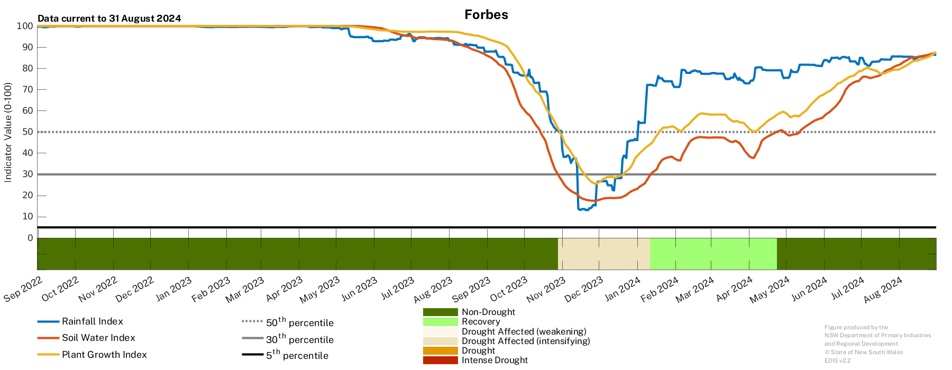
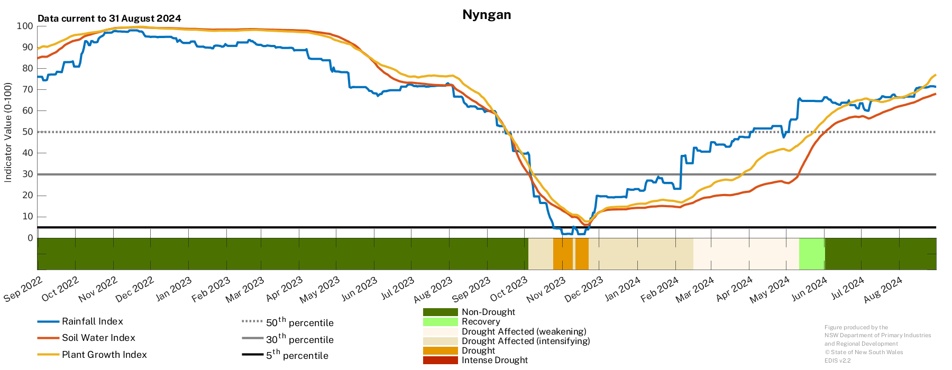
Individual Drought Indicators
Drought indicators continue to respond to follow up rainfall across the region.
- Rainfall has been effective in improving the drought indicators across the region.
- Further rainfall will continue the improvement in conditions and maintain the good production outlooks for many locations.
To access a Drought History chart for your Parish, visit the Seasonal Conditions Information Portal