January 2025
 Murray Local Land Services
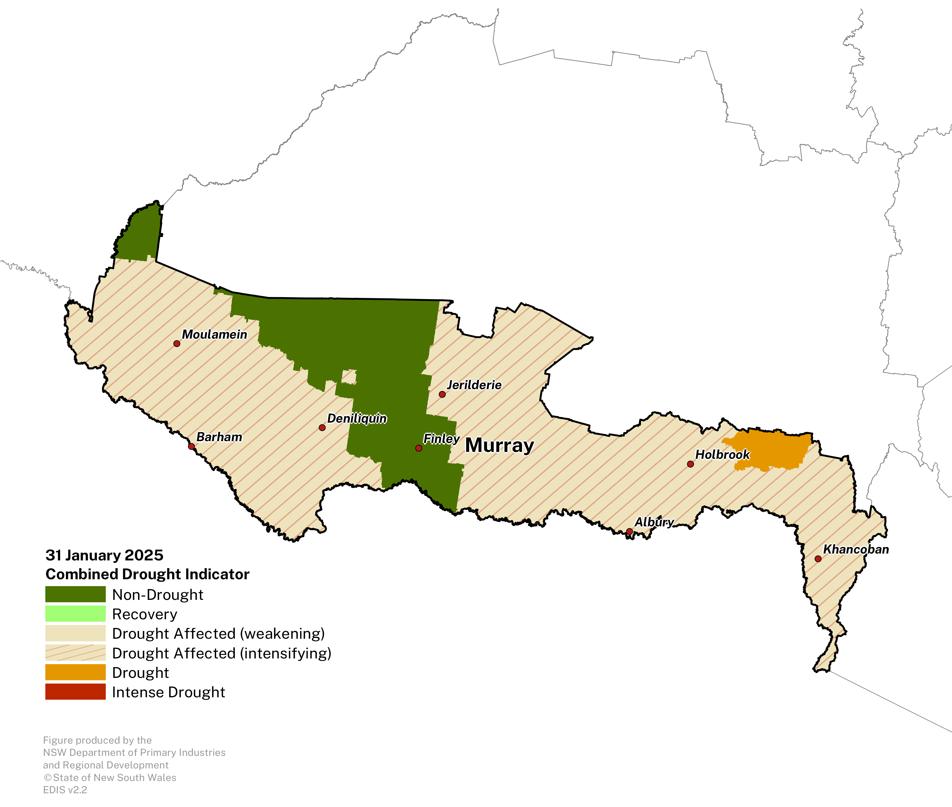
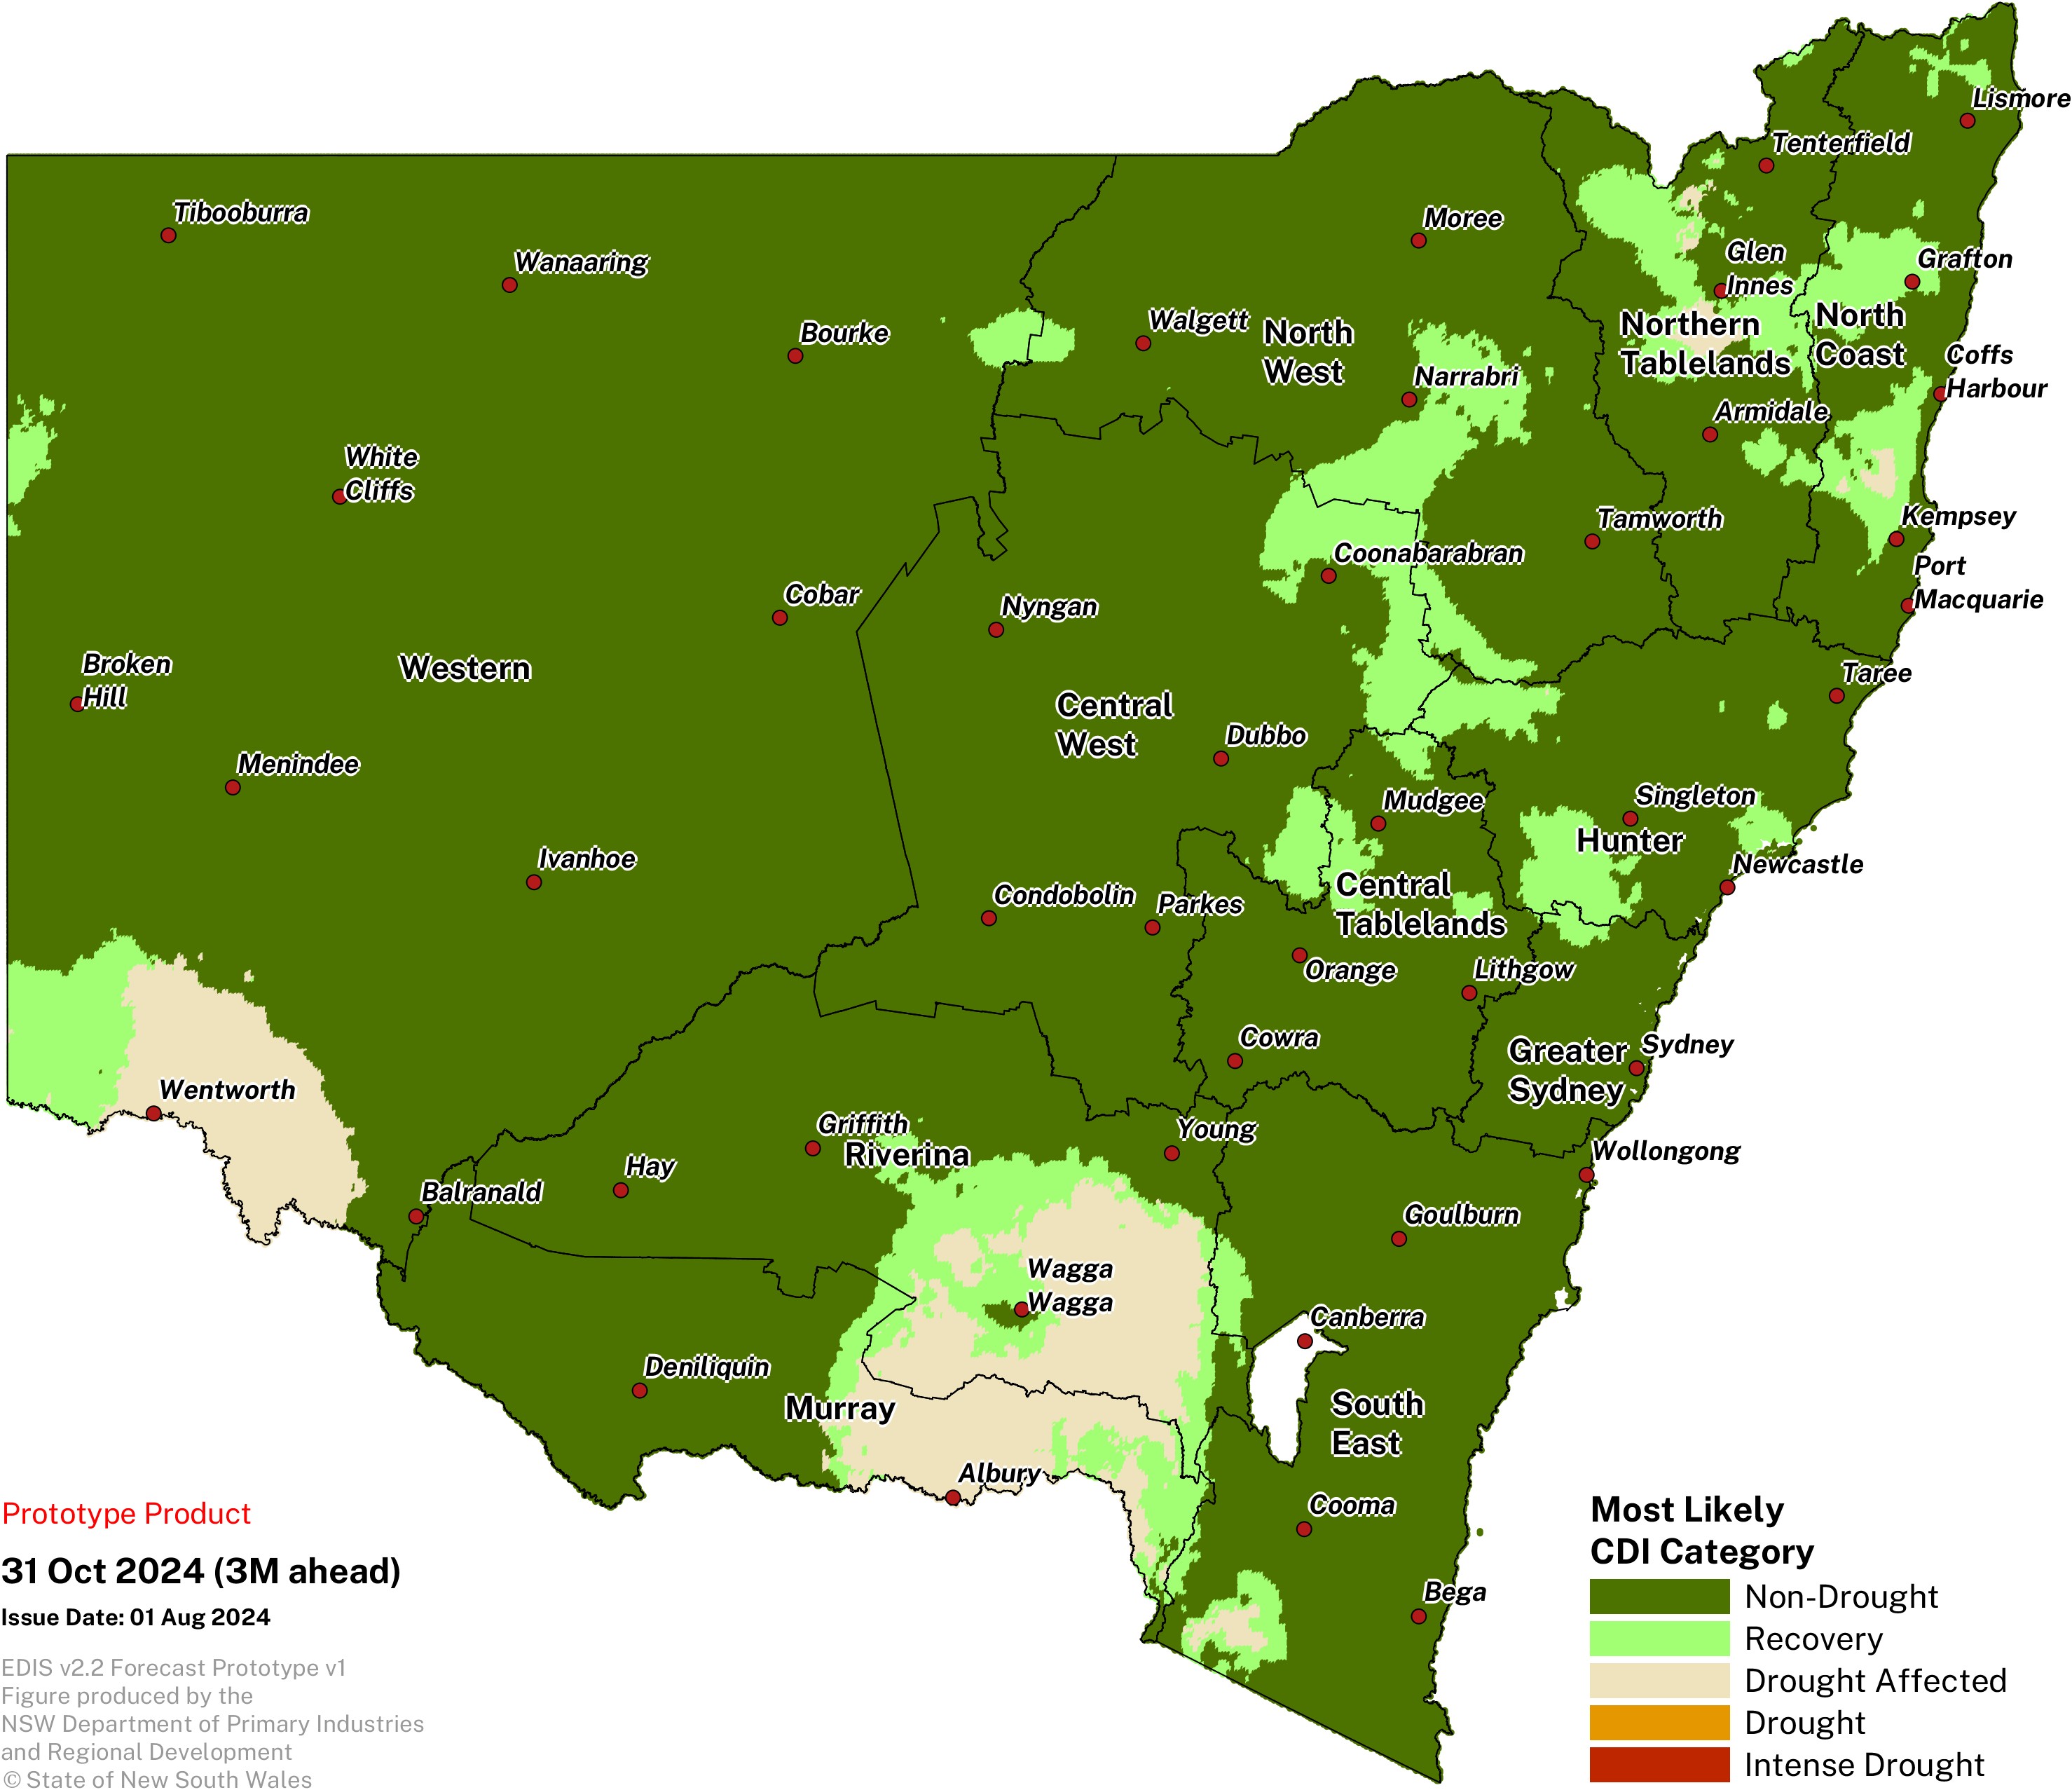
Conditions remain challenging, with an expansion of Drought Affected areas in the west of the region.
- January rainfall was average to below average for the region following one from longer-term rainfall deficits across the region. This is driving the decline in conditions, particularly in the west.
- The area in the CDI Drought Affected category has increased to 75%, compared to 37% at the end of December 2025.
- Further rainfall is needed to ensure that the extent of the Drought Affected category does not expand over the coming weeks.
- Some locations are monitoring feed and water supplies due to warmer temperatures throughout much of January.
- The drought forecast suggests that the extent of the region in Drought-Affected category will likely remain by the end of April 2025.
- The DPIRD continues to closely monitor conditions in this region.
Click on the scroll bar below the map to compare with previous months.
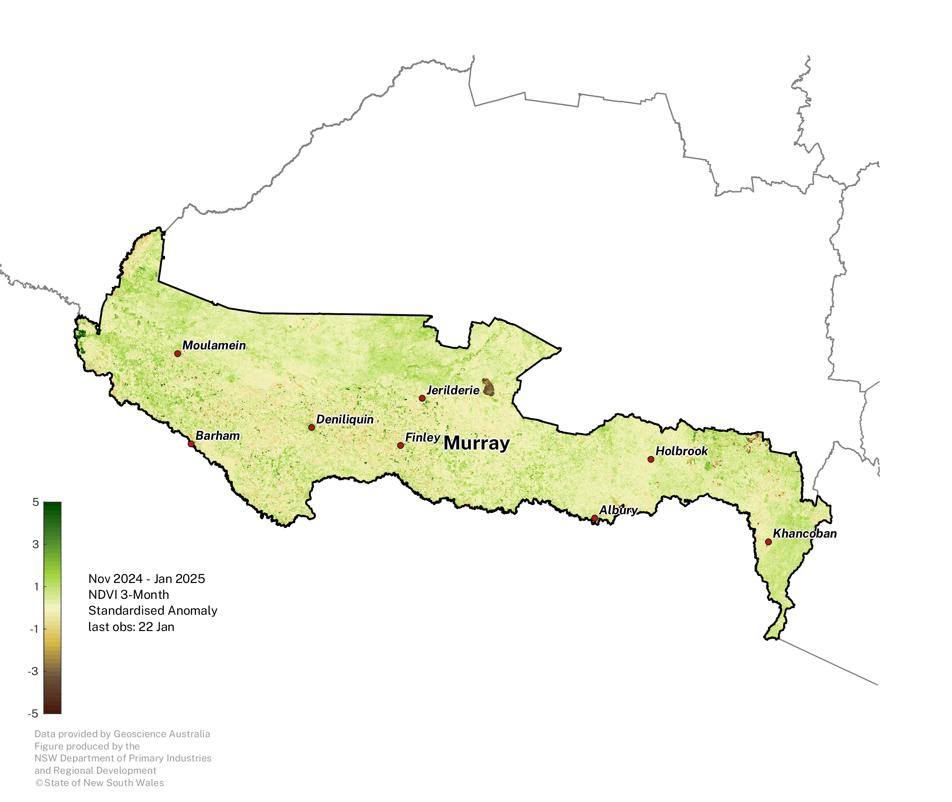
Normalised Difference Vegetation Index
Plant greenness levels remain highly variable across the region during the November to January period; anomalies remain below average for parts of the region.
Note that some of the extremely negative NDVI areas (brown patches) are water bodies.
The NDVI anomaly is a useful measure of vegetation density and plant health. It estimates the amount of green vegetation there is in the landscape compared to what is expected at the given time of year, against the baseline period 1987 - 2020.
Click on the scroll bar below the map to compare with previous months.
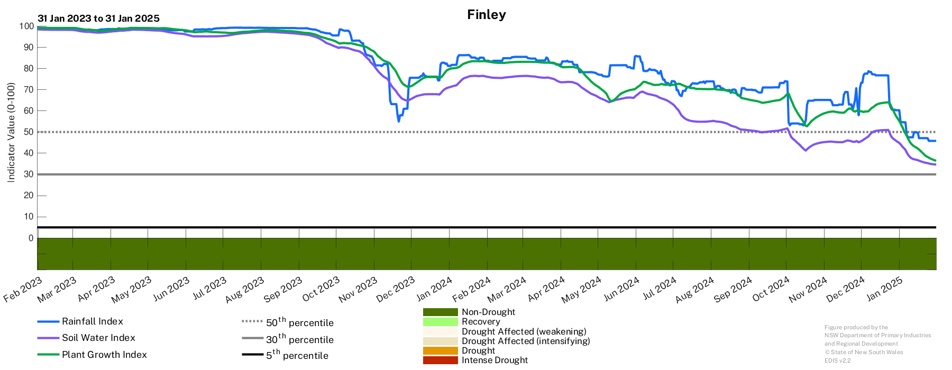
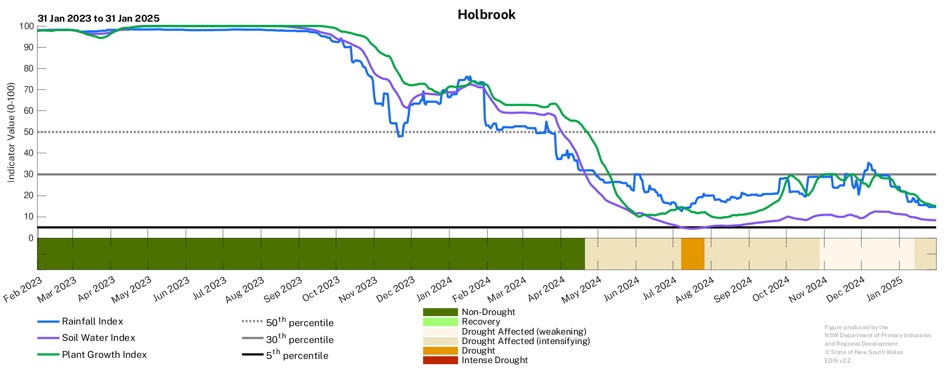
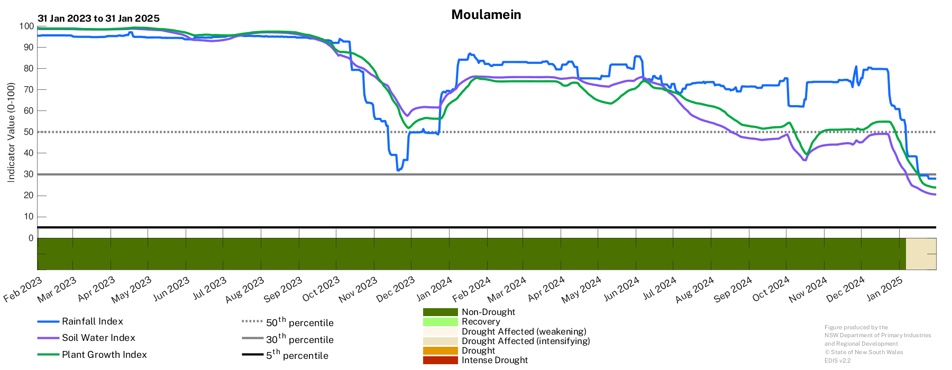
Individual Drought Indicators
Drought indicators remain variable across the region, with variable rainfall driving a decline in the indicators.
- Follow-up rainfall will be needed to ensure an improvement in conditions.
- The underlying drought indicator values remain low for some regions (including Holbrook).
- Other locations in the west of the region are experiencing a rapid decline in the underlying drought indicator values (including at Moulamein).
To access a Drought History chart for your Parish, visit the Seasonal Conditions Information Portal.