July 2024
 Western Local Land Services
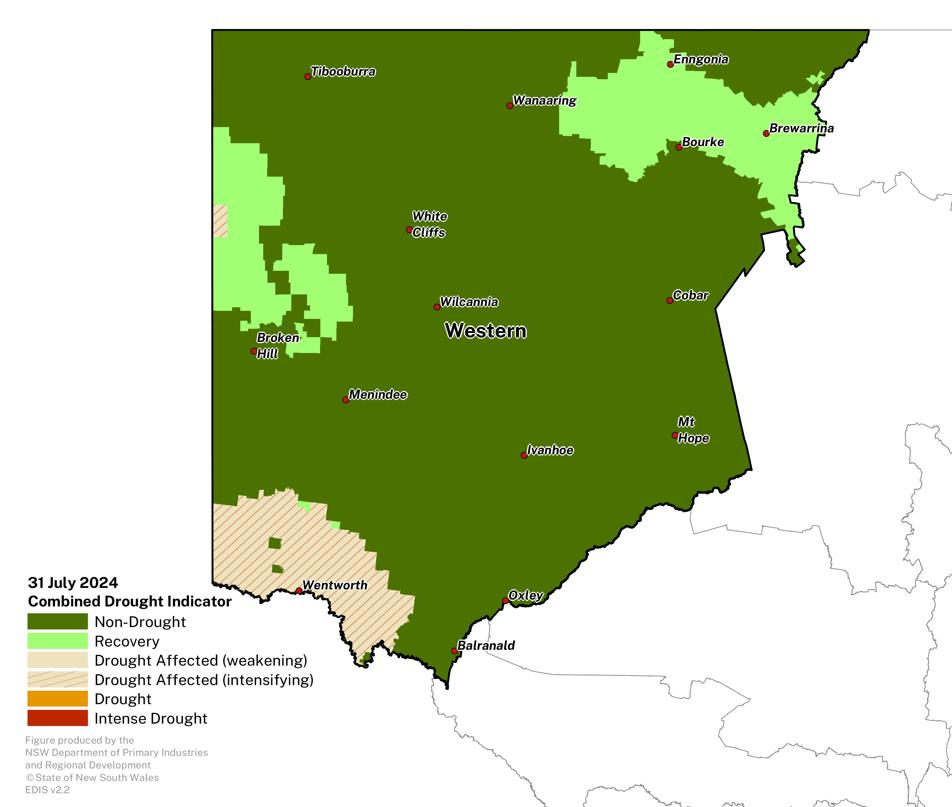
Conditions generally remain steady for much of the region, but some areas in the southwest continue to decline.
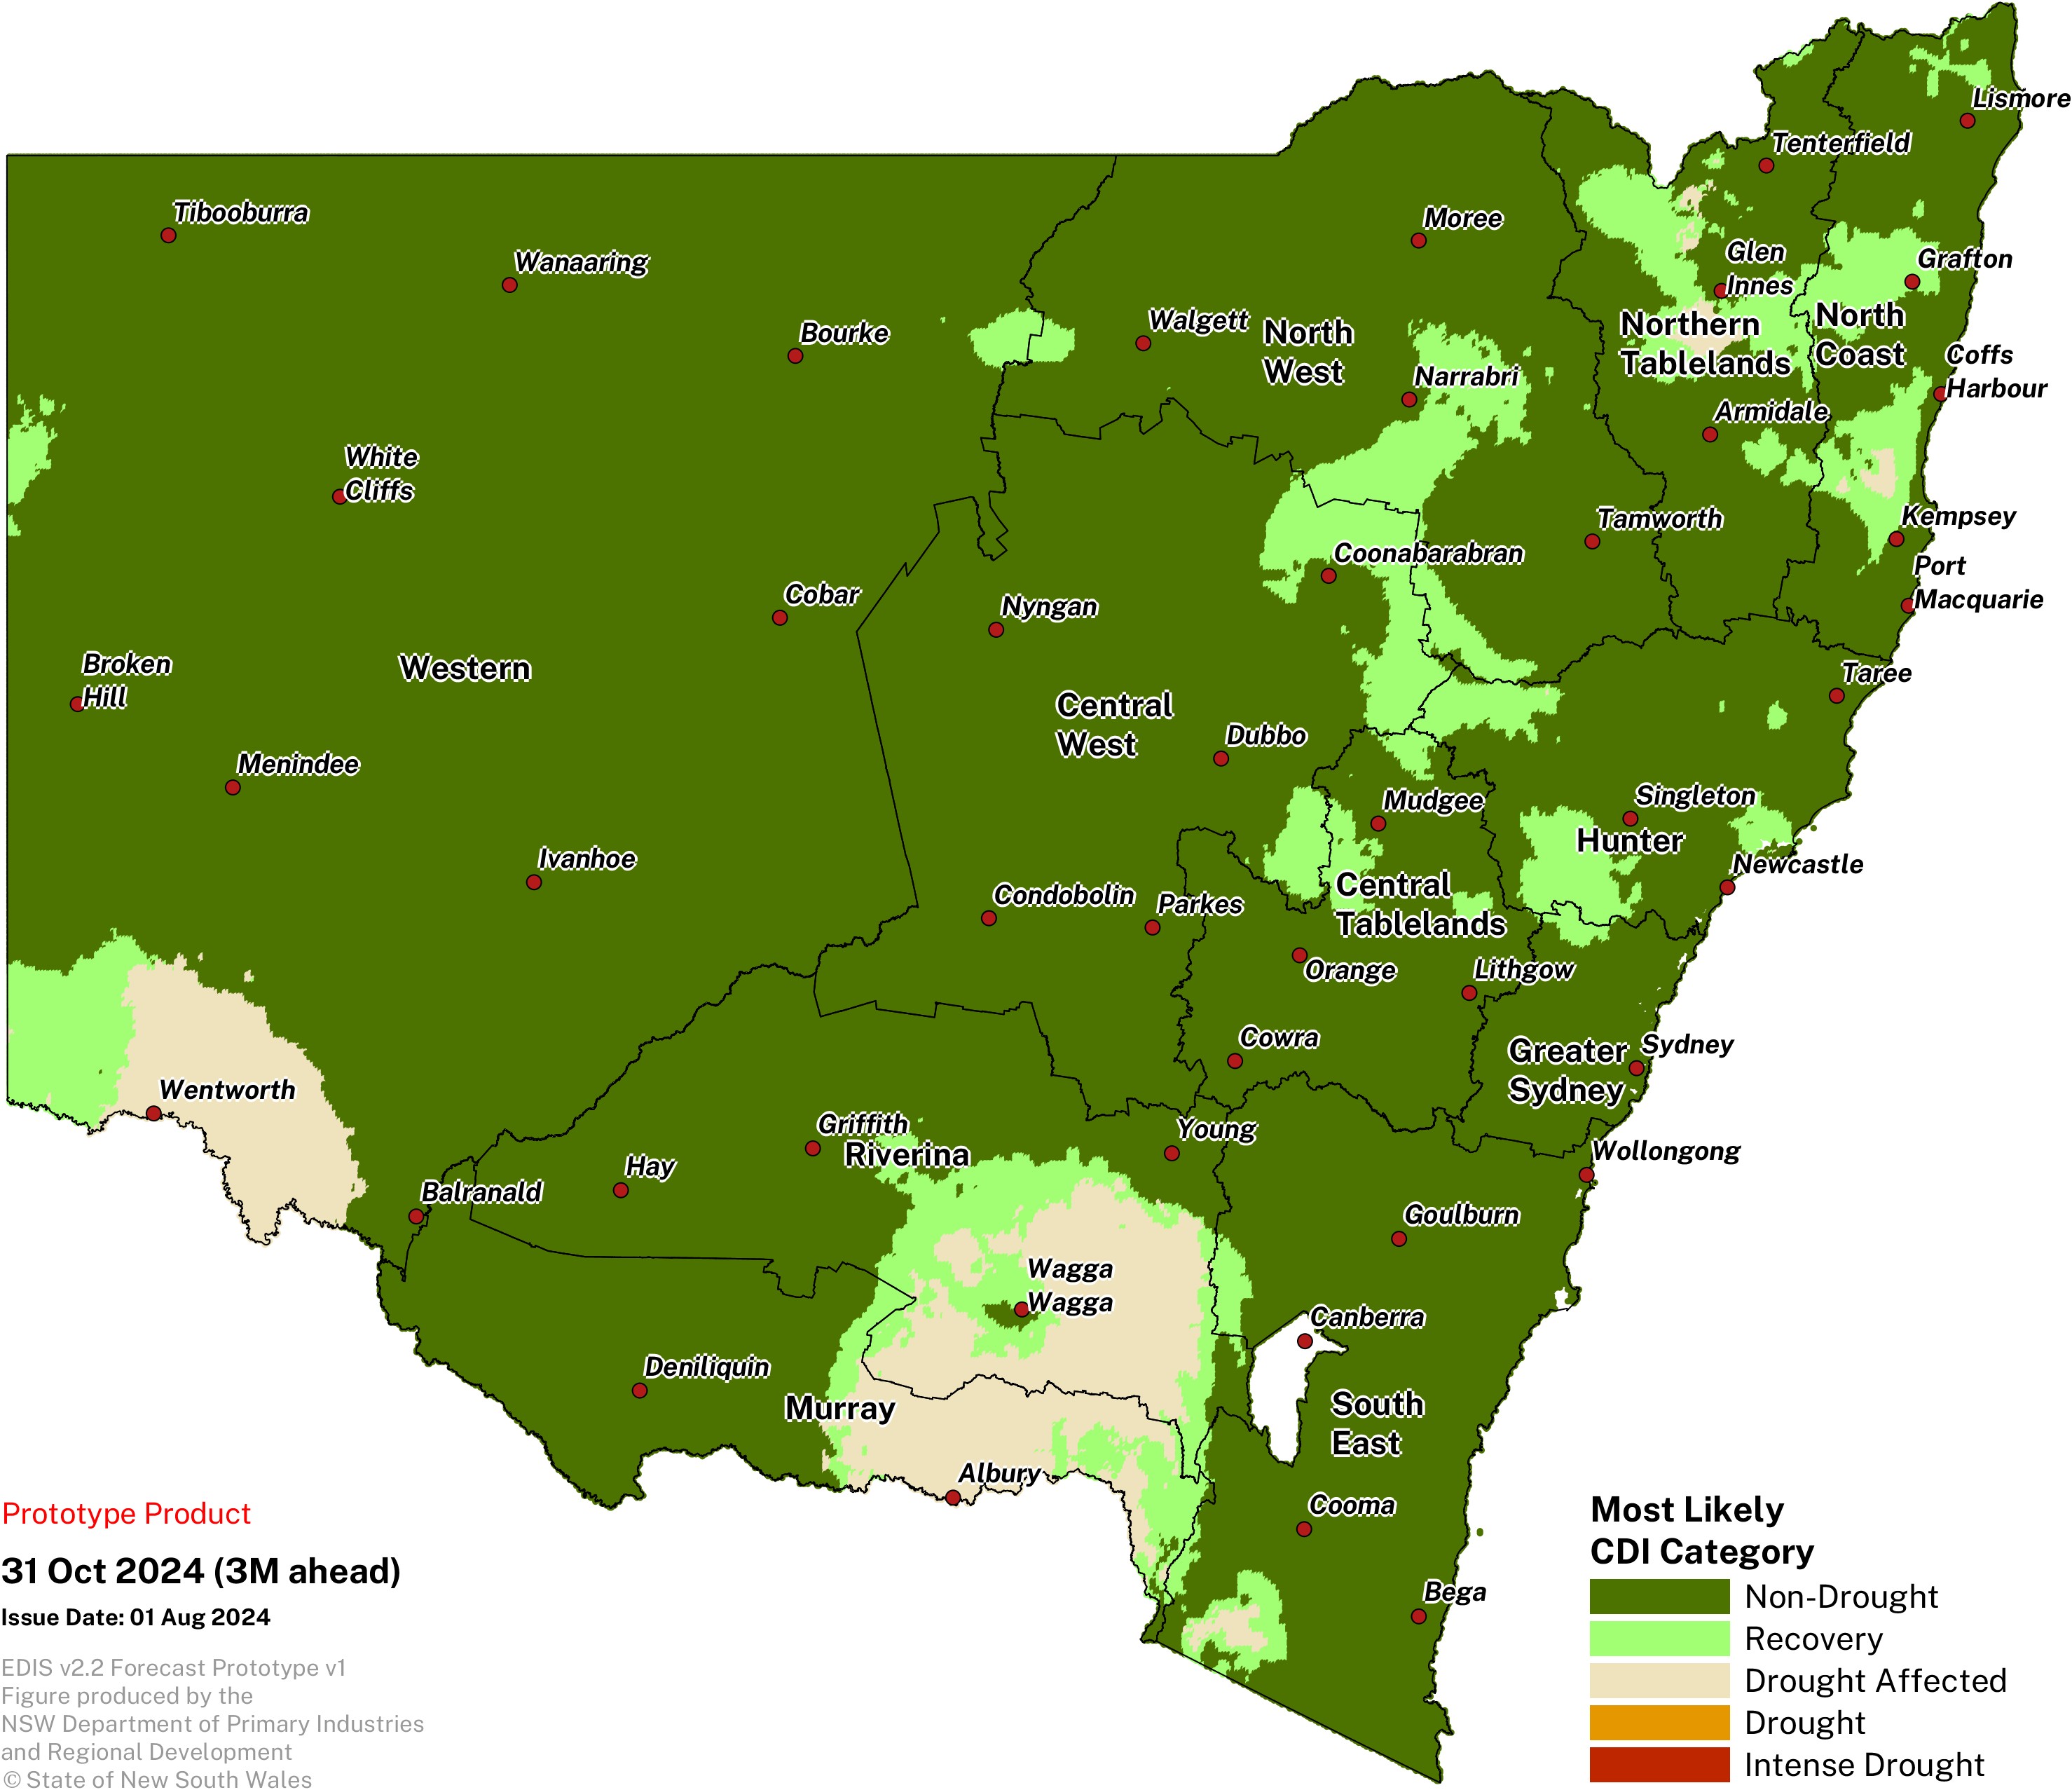
- The Combined Drought Indicator (CDI) shows almost all the region is in the Recovery or Non-Drought category at the end of July.
- Parts of the south and west continue to see an expansion of the Drought Affected category, now at 5%.
- July rainfall has been variable and generally below average in the southeast and above average in the northwest of the region. Some regions including Broken Hill, Tibooburra, Menindee, Wilcannia, Bourke, and White Cliffs received high rainfall totals in early July.
- Producers continue to monitor forecasts closely and adjust their management strategies accordingly.
Click on the scroll bar below the map to compare with previous months.
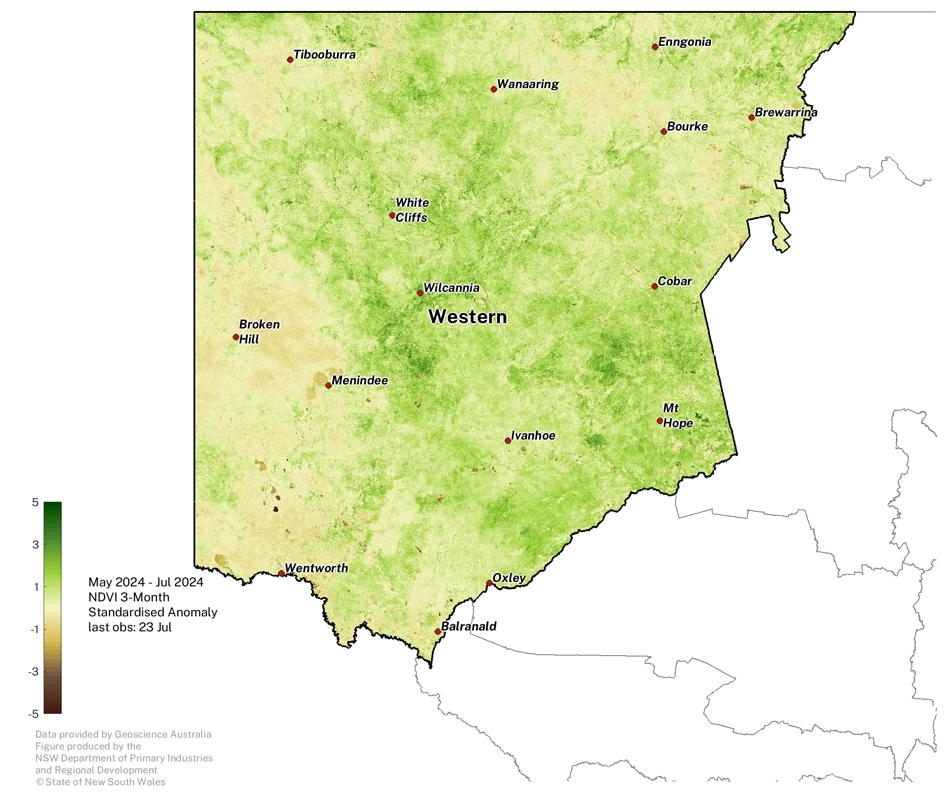
Normalised Difference Vegetation Index
Plant greenness levels are variable across the region during the May to July period..
Note that some of the extremely negative NDVI areas (brown patches) are water bodies.
The NDVI anomaly is a useful measure of vegetation density and plant health. It estimates the amount of green vegetation there is in the landscape compared to what is expected at the given time of year, against the baseline period 1987 - 2020.
Click on the scroll bar below the map to compare with previous months.
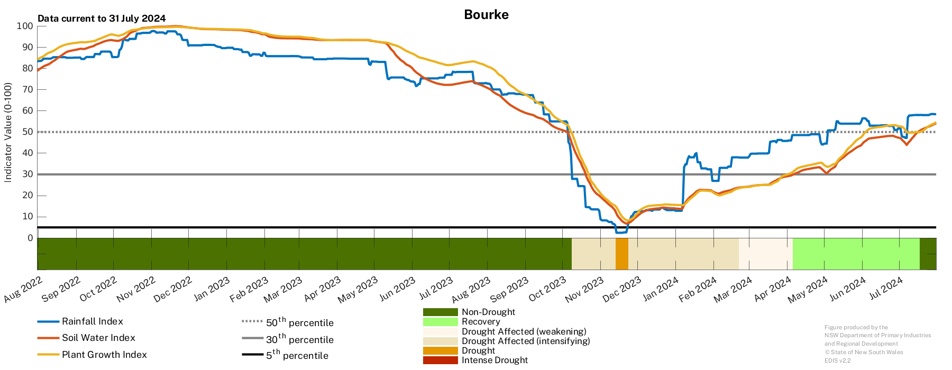
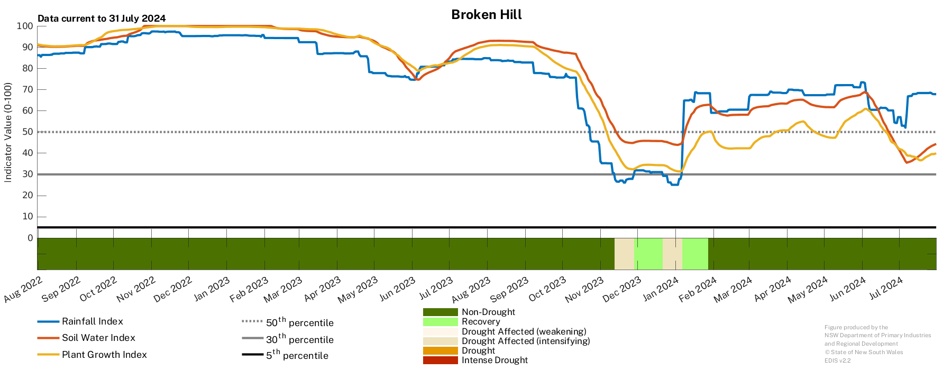
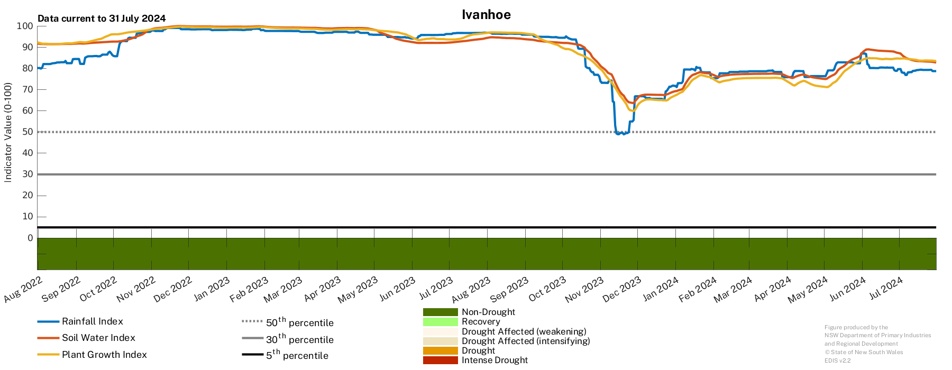
Individual Drought Indicators
Drought indicators remain variable but have continued to respond to recent rainfall.
- Continued rainfall over the past few months continues the aid a longer-term recovery across the Bourke region.
- Rainfall at Broken Hill has aided the improvement in the underlying drought indicators and production conditions are likely to continue to improve over the coming months.
- Indicators at Wentworth region continued to decline, and this area recently transitioned into the Drought Affected category. Further rainfall is crucial to maintain productive conditions.
To access a Drought History chart for your Parish, visit the Seasonal Conditions Information Portal.
