

cropping
Cotton
- GVP up 245% to a record $3.2 billion est.
- NSW cotton production record of 3.68 million bales est.
- Australian exports up, but lagged production at $2.2 billion, down 13% on 2018-19 levels.
Production
NSW Cotton Production & GS Water Allocations 201 31 j
- GS Allocation South
- GS Allocation North
- Cotton Production (RHS)
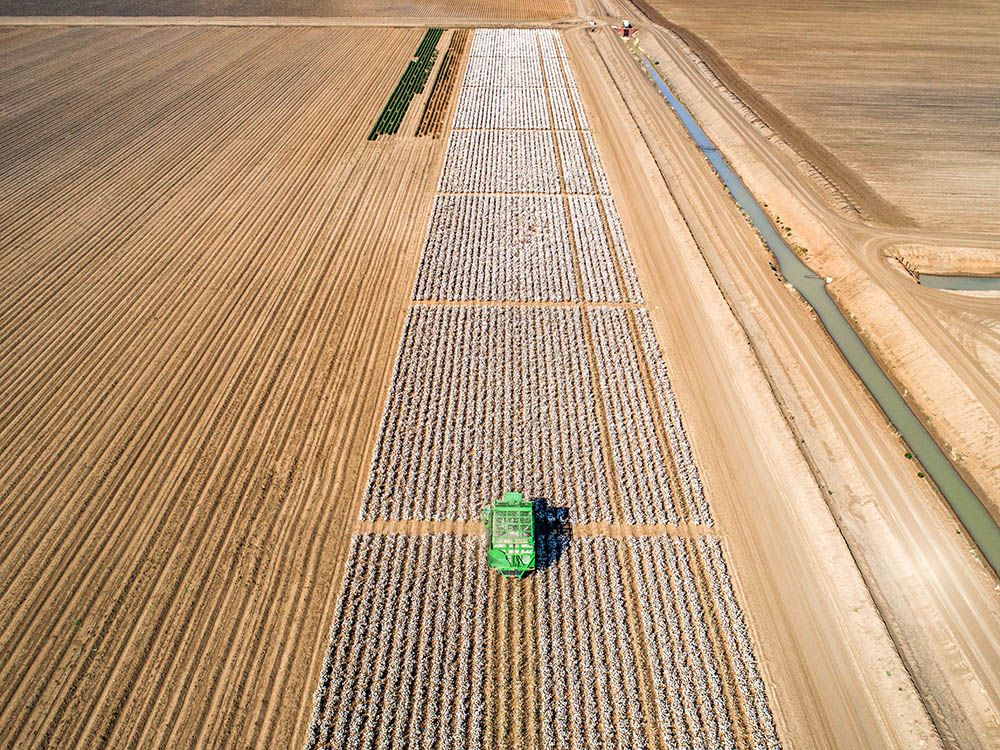
The combination of favourable soil moisture at planting, in crop rainfall, on farm storage and maximum water allocations opened the opportunity for the largest NSW cotton crop planting on record at 407 thousand hectares. Average yields were estimated to increase slightly to 9.1 bales/ha resulting in a new record NSW cotton crop estimated at 3.68 million bales, 13% higher than the previous record of 2017-18. 201 The great conditions did not come without challenges with a cool start to the season impacting plant stands which required some re-sowing particularly in Southern NSW, while in crop rainfall, storms and some flooding took the shine off some yields in the Northern Basin and resulted in some crop losses. 32
NSW Regional Cotton Production Estimates 32 k
- Area 2020-21
- Area 2021-22
- Production 2020-21 (RHS)
- Production 2021-22 (RHS)
Price
Cotton & Commodity Price Index 37 50
- US Cotton Futures #2 Price indexed (USD)
- RBA Commodity Index (USD)
Trade and Macroeconomic Conditions
The most important trade issue continues to be the ongoing impacts of declining market share resulting from unofficial Chinese trade boycotts of Australian cotton, traditionally Australia’s largest cotton export market. Reports first emerged of Chinese cotton mills being instructed to avoid buying Australian cotton in October 2020, and subsequently China’s market share dropped from 63% in 2019-20, to 32% in 2020-21 and just 3% in 2021-22. 35 The silver lining has been the Australian cotton industries ability to diversify export markets, with Vietnam and Indonesia more than making up for the loss in exports to China. This diversification has come at some cost however, with many major markets being lower value markets relative to China.. For example, the export price to Australia’s largest 2021-22 market of Vietnam was 8% lower than the export unit price to China in 2021-22, and therefore this is the key factor underpinning declining basis levels discussed previously. 35
Determining which countries have been replacing Australia’s trade flows, which accounted for approximately 26% in value terms of Chinese cotton imports in 2018 and 2019 calendar years, is more difficult. Our major export competitor, the USA, lifted its market share from roughly 27% in 2018 and 2019 to 41% from 2020 through to March 2022, while Brazil has also lifted from approximately 20% to 31% over the same time period. 46 Some smaller exporters have also increased market share, most notably India, Kazakhstan, Turkey and Tajikistan although persisting trends are less obvious. 46
Outlook
Unfortunately the same La Nina weather system that has delivered high GS allocations has also delivered an extremely wet and cool cotton sowing period. This weather system has resulted in many fields that were earmarked for cotton being unworkable or underwater, and as such the current NSW forecast for 3 million bales has downside risk at this point in time. 201 Cotton futures prices have also had a large setback, with prices declining from their pre-June peaks. This is attributed to upside corrections to the US cotton production numbers as well as collapsing consumer confidence especially within China, where COVID lockdowns are hampering economic activity.
Strong cotton prices at the beginning of the Northern Hemisphere planting season stimulated stable cotton plantings, with global area harvested forecast to remain steady on the year prior. 256 However, the firm price at planting also meant cotton was sown in less than favourbale seasonal conditions, particularly in the US where the portion of the crop in poor/very poor condition is up significantly year on year and Texas crop abandonment is at one of the highest rates in history. 38
Stronger Primary Industries Strategy
DPI weed management program: Keeping NSW parthenium-free
NSW DPI has been leading the charge to keep our state free from the devasting parthenium weed since it was first detected here in 1982.
The 2021 grain harvest saw NSW DPI inspect more than 250 headers which came into NSW from Queensland, ensuring the equipment crossing the border had no parthenium plants or seeds. NSW DPI operates four border inspection facilities to help keep NSW parthenium-free and support farmers and contractors in fulfilling their legal duties.
Strategic Outcome

In one case, a 65-hectare parthenium weed infestation near Croppa Creek is being managed after an observant agronomist found parthenium hidden in a sorghum crop. Farmer Lyndon Mulligan contacted Gwydir Shire Council and is now working as part of the team, led by DPI, which has treated thousands of parthenium weed plants on the farm.
“We have never had parthenium weed on the property and are all fortunate parthenium weed is taken seriously in NSW,” Mr Mulligan said. “As farmers managing this outbreak, we appreciate the specialist support from DPI, Local Land Services, Gwydir and Moree Plains Shire Council. Parthenium can only be successfully managed and kept out of NSW through the continued cooperation, support and hard work of government and the community.”
While machinery was inspected by the farmer and contractor before entering the property, the source of the infestation may have been equipment used in Central Queensland, an area with widespread parthenium weed infestations. Growers are urged to ensure equipment from Queensland is free from all plant material, dust, soil and accumulated grease or has been treated with a seed sterilant before entering NSW. Operators of all machinery, not just grain harvesters, have a legal duty to prevent their equipment from spreading parthenium weed into NSW, which is covered by the General Biosecurity Duty under the NSW Biosecurity Act 2015.
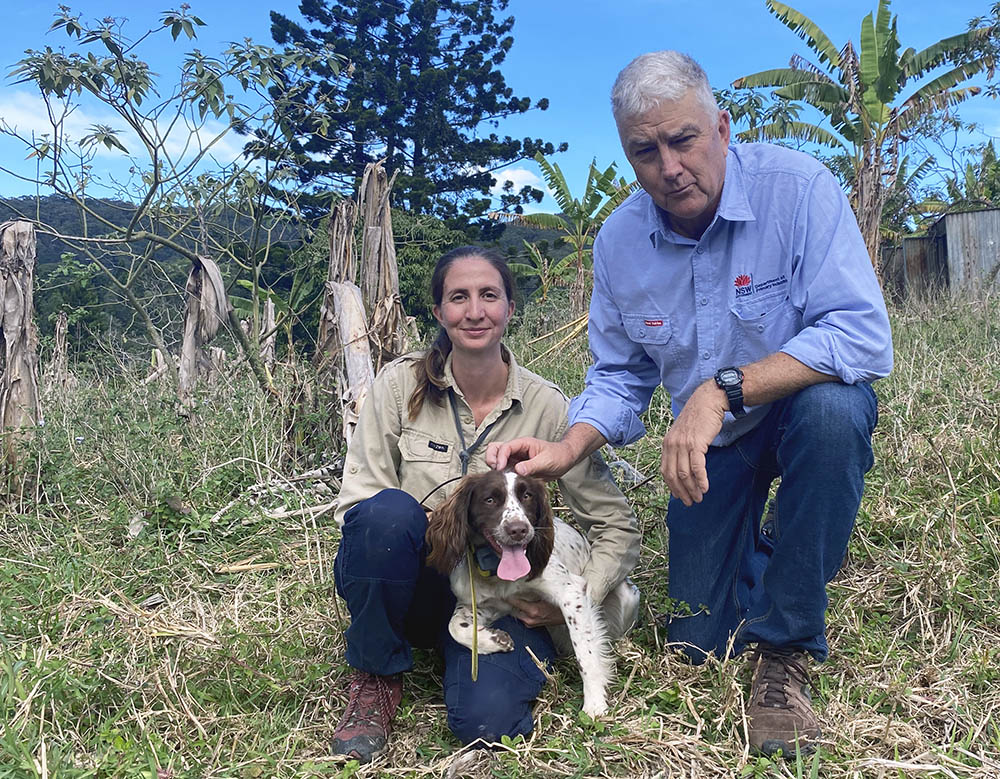
Weed detection dogs too, are playing an important role in sniffing out newly germinated parthenium weeds, which are difficult to find in dense undergrowth. NSW DPI, LLS and local government staff worked with dogs to search for parthenium weed at infestation sites near Parkes, Croppa Creek, Broughton Vale, Missabotti, the Upper Hunter and Palmvale. Following treatment and removal of parthenium plants, biosecurity staff returned with Connor and Dash, specially trained dogs which found very small seedlings biosecurity staff were unable to see.
The department continues to coordinate surveillance of known high-risk areas in collaboration with local councils, weed control authorities and LLS regional weed coordinators to keep NSW free of the weed. Parthenium hysterophorus spreads rapidly, is dangerous to grazing animals, can host crop viruses and reduces land values. Contact with the plant or pollen can cause serious allergic reactions in people.
If you suspect you’ve seen parthenium weed, call the NSW DPI Biosecurity Helpline, 1800 680 244, or local council for identification and assistance.
More information, including parthenium identification at different growth stages is available on the NSW DPI website.
