

At the date of publication, detailed industry information for 2021-22 is not available, consequently the following production, plantation and price commentary analyses 2020-21 industry data.
Forestry
- GVP $440 million est. Down 3% year-on-year.
- The higher rate of softwood supply was driven by ongoing bushfire salvage operations.
- NSW had 348 thousand hectares of commercial plantations in 2020-21, second only to Victoria’s 383 thousand hectares.
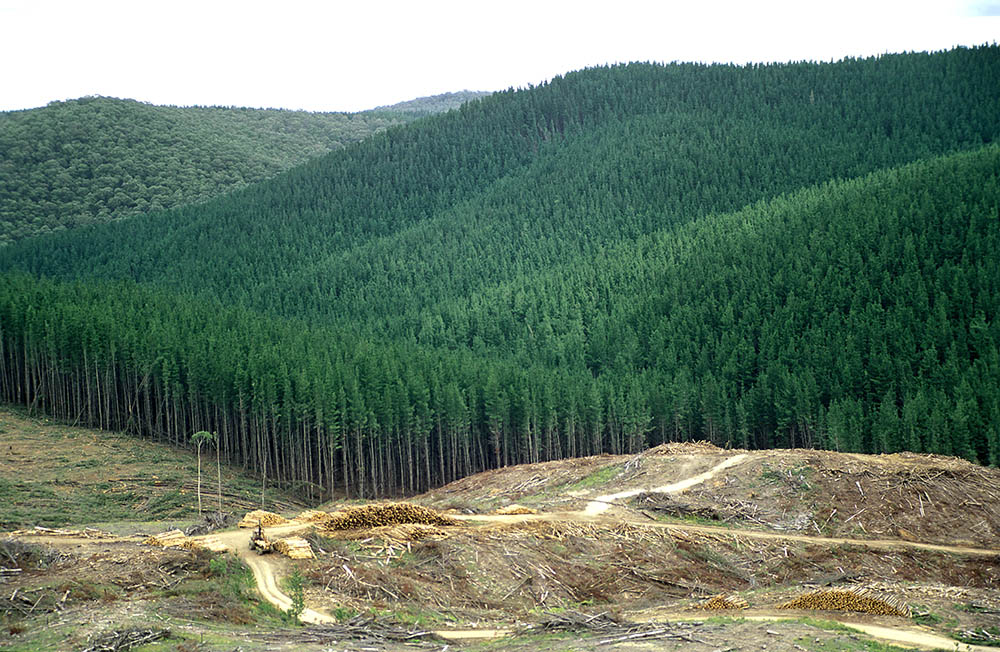
Fire salvage operations continued, recovering timber from trees burnt during the 2019-20 bushfires and replanting in the fire affected regions.
Production
Total log production in NSW decreased 2% to 6.4 million cubic metres in 2020-21.
34
Softwoods generally come from commercial plantations. Softwood production in 2020-21 increased by a modest 2% to 5.7 million cubic metres. 34 This was 25% higher than the normal rate of production and the largest volume ever harvested in a single year. 33 The higher rate of softwood supply was driven by the fire salvage operations, intensified by the tight salvage timeframe. Burnt timber, damaged and dying trees deteriorate rapidly and become vulnerable to pests and disease. Two-thirds of the 5.7 million cubic meters harvested was fire-salvaged wood. 33 Softwood sawlog production was steady and accounted for the majority of softwood production at 3.1 million cubic metres, whilst paper pulplog production increased slightly by 1% and accounted for 2.4 million cubic meters. 34 Other minor log products were up 68% year-on-year to 238 thousand cubic metres.
Hardwood production was down significantly to 698 thousand cubic metres, a 22% decline over the previous year. 34 This decline was particularly in native forests due to heightened environmental protection measure and weather damaged supply (in response to bushfire and extreme wet weather and flooding). Sawlog production from hardwood plantations increased 12% over 2020-21 34 to which, to a small degree, offset the decline in native sawlog production. Hardwood production mainly consisted of sawlogs (446 thousand cubic metres harvested) and woodchip pulplogs (210 thousand cubic metres harvested). 34
Production nurseries in Tumut and Grafton were also expanded to fast-track replanting activities with a record 16 million softwood and hardwood seedlings planted during the 2021 calendar year.
33
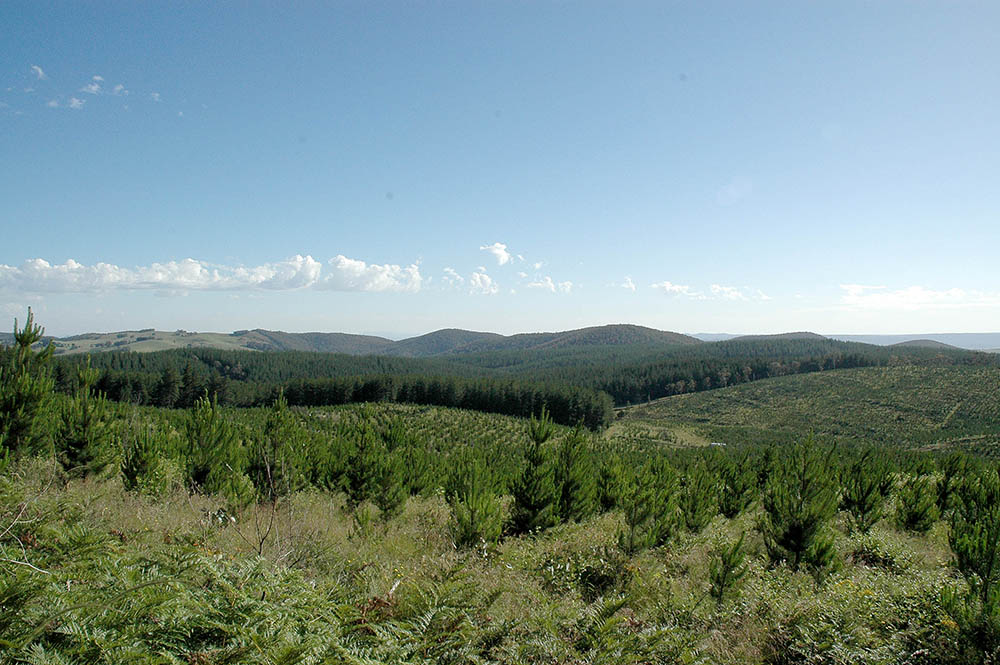
Plantations
NSW had 348 thousand hectares of commercial plantations in 2020-21, second only to Victoria’s 383 thousand hectares.
34
Softwood plantations accounted for 84% of commercial plantations at 293 thousand hectares with a hardwood plantation area of 55 thousand hectares.
34
The hardwood plantation area has fallen by a total of 37% since 2018-19.
Whilst the volume of softwood harvested in NSW has increased by about 94% over the past 20 years, the amount of land plantations has been relatively stable since 2014. No new softwood plantations have been established since 2015-16. 34 Nationally, a similar trend has been observed in terms of the area under plantation which has been largely stagnant since 2014 however, since 2015, a total of 9,000ha of new softwood plantation have been established in Western and South Australia. 34
Hardwoods largely come from native forests with native plantations only contributing approximately 43% of total NSW production. Supply is projected to fall further when Queensland and Western Australia end native logging in 2024, and Victoria in 2030.
Price
Average market prices for saw and pulp log prices are difficult to determine due in part to variations in product end-use and quality of selected forest products; the large range of external factors that influence market values (both domestically and globally), and market prices that have been determined commercial-in-confidence. Whilst national and international trends in log prices can be illustrated, the effect that they may have on NSW log prices does fluctuate significantly.
Over the past few years, this situation has been further complicated by various supply-chain disruptions and economic volatility due to the global pandemic which have tested traditional industry supply and demand factors.
ABARES log price index measures nominal prices paid per cubic metre at the mill door and shows that the price index for both hardwood and softwood fell over the 2020-21 year.
34
Log price indexes by log type 34
- Hardwood Native saw and veneer logs
- Hardwood Native pulplogs
- Hardwood Plantation saw and veneer logs
- Hardwood Plantation pulplogs
- Softwood Native saw and veneer logs
- Softwood Native pulplogs
- Softwood Plantation saw and veneer logs
- Softwood Plantation pulplogs
Trade and Macroeconomic Conditions
Trade tensions between Australia and China remained an ongoing challenge for the industry. In late 2020, China suspended NSW and Western Australian timber imports after officials claimed there were detections of live insects in consignments. Within a few months, virtually all Australian timber exports to China were suspended. As at the time of writing, this suspension has not been lifted. Prior to the suspension, NSW exported $89.6 million in forestry products to China in 2020-21, down from $154 million in 2019-20.
35
For the previous five years, exports to China accounted for an average 82% of the value of total NSW exports. In 2021-22, NSW exports to China totaled $238,000 and accounted for only 0.41% of total NSW wood product exports.
35
Whilst exports to other key markets such as India and South Korea have significantly increased in value over the past year, the loss of the highly valuable Chinese market had a significant impact on the total value of NSW forestry exports.
NSW wood product exports in 2021-22 were valued at $58.2 million, down 58% year-on-year. 35 In value terms, up until the loss of the Chinese export market, approximately 90% of NSW wood product exports traveled to just two main markets, namely China and South Korea. 35 In 2021-22, whilst exports diversified slightly, exports were largely limited to five key markets namely South Korea, India, Vietnam and Taiwan. 35
While Australia and NSW are net exporters of unprocessed wood (primarily unprocessed or minimally processed products like wood in the rough or sawnwood), they are net importers of processed wood products. Due to the reduction in domestic supply, Australian builders have become more reliant on imported timber. The Australian Forest Products Association (AFPA) forecasts that Australia’s reliance on imported timber will double by 2050 and that there will be an implied gap between demand and local production of 2.6 million cubic meters per annum. 31
The largest imports by value to NSW were Builders’ Joinery and Carpentry of Wood ($163.3 million), Wood, Continuously Shaped ($141.6 million), and Plywood, Veneered Panels and Similar ($140.8 million). Roughly half of NSW’s total wood product imports in 2021-22 were from New Zealand and Germany. Imports from New Zealand in 2021-22 totaled $45 million and were comprised primarily of pine sawnwood.
35
Imports from Germany totaled $44 million and comprised mainly of fir sawnwood.
35
Employment and Value Added
In 2021-22, total employment in forestry and related industries in NSW increased by 5% year-on-year to 18,800. Employment levels in forestry and logging were down year-on-year however, offset by employment increases in wood product manufacturing and pulp and paper product manufacturing. NSW accounted for 29% of Australian employment in the sector, which decreased by 1% to 63,600.
Industry value added for 2021-21 (measured as production output less intermediate inputs) remained steady year-on-year and was estimated at $3 billion. Industry value added for Australia was estimated at $8.7 billion. 185
Outlook
The damage done to the plantation and native forests in both NSW and Victoria from bushfires is expected to continue to impact timber supplies in the medium and long term. Supply will be mitigated to a small extent with salvage from fire-affected plantations leading to a reduced level of harvesting in unburnt areas.
33
New trade sanctions in response to the ongoing Russia and Ukraine conflict may have the potential to further impact imported timber supplies. Whilst Russia is not a major supplier of timber products to Australia (in terms of total value), they are one of the largest suppliers of engineered wood products which includes laminated veneer products and plywood), key structural elements used in residential and commercial buildings and timber flooring systems. The invasion of Ukraine has led international forestry groups to deem timber from Russia and Belarus “conflict timber” and as a result, Australia will place tariffs of 35% on timber from the two nations after October 2022. No further updates on this situation were available at the time of writing (September 2022).
Stronger Primary Industries Strategy
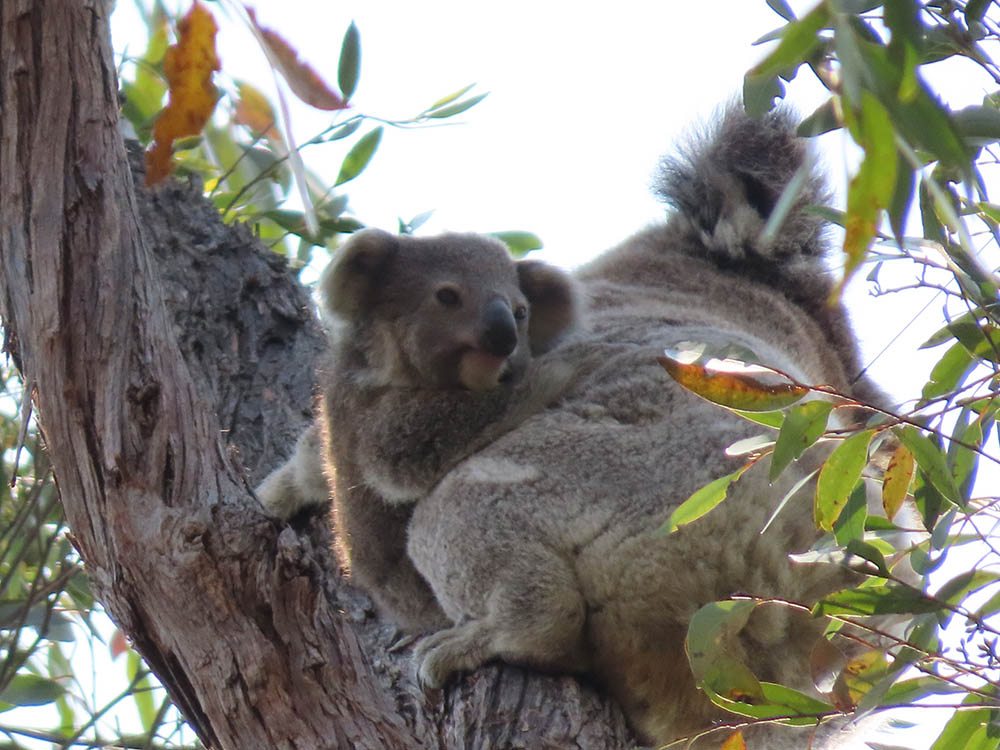
Response of Koalas to the black summer fires and timber harvesting
With koalas just listed as Endangered, it's more important than ever to scientifically assess the key threats to their populations. DPI Forestry's ecology team have recently conducted parallel research projects investigating the impact of forest disturbances – bushfires and timber harvesting – on koalas as part of efforts to better understand koala habitat threats and risks.
Strategic Outcome

Sustainable Resources and Productive Landscapes
Bushfire impact
Koalas were monitored pre and post the 2019/2020 bushfires in northern NSW using acoustic arrays to estimate density. Acoustic arrays sampled large areas in three forests with a gradient in fire severity and three unburnt control forests.
The research found that koalas temporarily disappeared from high severity fire areas, however, numbers in lower severity fire areas showed little impact from fire and koalas were recorded bellowing during their mating season both immediately after the fire and one year later.
In the areas greatly affected by high severity fire, koalas were found to have commenced recolonisation within the following year.
Dr Brad Law said the research assessed the extent of impact of hot severe bushfires on koala populations, and how the impact varied according to fire severity and patchiness. Signs of recovery of koala numbers within 12 months were encouraging. The DPI Forest ecology team is continuing to monitor koala recovery.
Response to harvesting In a parallel three-year study, DPI Forestry scientists recently assessed the response of koala density to timber harvesting across 3,600 hectares of forest. The team used acoustic arrays to record bellowing koalas combined with advanced modelling techniques to provide an estimate of koala density in 400 ha patches of forest. The acoustic arrays were also supplemented with koala detection dogs to confirm sex ratio from fresh scat. The experiment assessed change in koala density after selective harvesting with regulations in place to protect environmental values, and additional sites that were heavily harvested 5-10 years previously, now dominated by young regeneration. Paired sites in nearby National Parks served as controls. The study concluded that native forestry regulations, which set aside a network of environmental protections, provided sufficient habitat for koalas to maintain their density, both immediately after selective harvesting and 5-10 years after heavy harvesting. Koalas were recorded at almost every song meter (225 in total) before and after harvesting, indicating koalas were widespread across all arrays. Average density was estimated to be higher than expected for forests in NSW. The study found no significant effect of selective harvesting on density and little change was evident between years or between state forest and the control sites in national parks. Also, density 5-10 years after previous heavy harvesting was equivalent to control sites, with one previously harvested array supporting the second highest density in the study. In north-east NSW, regulatory settings introduced in 2018 result in 57% of the state forest landscape being excluded from harvesting and this is key to supporting koala populations, especially during the initial stages after a forest disturbance. The outcomes for koala density are also consistent with the findings of GPS tracking of individual koala behaviour through this same period. GPS tracking demonstrated that koalas (including breeding females) routinely used disturbed areas, areas of regeneration and older forest in exclusion zones.
Publication - Regulated timber harvesting does not reduce koala density in north-east forests in New South Wales
