Wine Grapes
- GVP $207 million est. Down 18% year-on-year.
- The total value and volume of NSW wine exports declined in 2021-22 with value down 9%.
- Grape quality across the various wine regions was mixed depending on how growers and wineries chose to manage the challenging seasonal conditions.
Production
Vintage 2022 was marked by extreme weather fluctuations, influenced by the ‘La Nina ‘ weather pattern which resulted in significant spring and summer rainfall and milder temperatures. Prolonged and heavy rain was a key feature of many key wine growing regions. Whilst ample soil moisture over winter and spring facilitated good bud burst and growth and reduced the need for supplementary irrigation, this, combined with cool summer nights and mild daytime temperatures increased disease pressures, with mildew the chief concern, and ripening was extremely slow. 110 In some regions, particularly some high-altitude cool climate areas, the mild summer temperatures resulted in low sugar levels which affected grape maturity and in others, continued heavy rain affected fruit set and yields. 109 110
Grape quality across the various wine regions was mixed depending on how growers and wineries chose to manage the challenging seasonal conditions. As with the previous 2021 vintage, harvest in many areas was delayed, whilst in other regions, the ongoing threat of inclement weather and frosts prompted a rush to harvest, picking grapes that were not yet fully ripe. However, for many, the delayed harvest proved a blessing in disguise. allowing the fruit to hang until some very welcome drying winds and warm, sunny periods during late summer and early Autumn.
Price
The overall average purchase price of red grapes decreased by 22% year-on-year from $556 per tonne to $431 per tonne, while the average price of white grapes remained steady at $436 per tonne. 32 At a national level, the divergence between red and white average price has increased steadily since 2011, driven by strengthening relative demand for red wine.
Individually, most of the NSW red varieties declined in average value, with Shiraz down 26% year-on-year, Merlot down 18%, and Cabernet Sauvignon down 22%. Pinot Noir was the only red variety that recorded an increase in average price, up 11% year-on-year. For the whites, average prices remained relatively steady for Chardonnay, Verdelho, Semillon and Pino Gris/Grigio. Sauvignon Blanc had the largest increase in average value, up by 10%, followed by Riesling (up 2%). Average prices softened for Prosecco, down by 16%, Chenin Blanc by 7% and Gewürztraminer by 6% year-on-year. 32
NSW wine grape prices by region and year-on-year change in value 109
- 2020-21 (LHS)
- 2021-22 (LHS)
- YOY change (RHS)
Trade
Exports to China decreased in 2021-22, down 88% year-on-year by volume and 91% in value. 35 The loss in value of NSW exports to China from June 2020 to June 2022 totaled $58 million and over the same time period, NSW wine exports to the rest of the world also decreased, by $21 million. Whilst NSW traditionally exports less wine to the China market than other states, and exports may diversify over time, the loss of a market as big as China to NSW wine exports cannot be understated. Anecdotal evidence suggests that some Australian wineries have been swapping their own source of supply for Chilean material in an attempt to continue sales of their brand in China. 111
Excluding China, in 2021-22, NSW wine exports declined by 12% in volume to 172 million litres and 6% in value to $469 million. 35 The US was the number one destination by value, decreasing marginally by 0.5% year-on-year but received a larger proportion of NSW wine at 48% of total exports. The UK was the second most valuable market for NSW wine but was the largest market by volume.
NSW bottled white wine exports increased 0.6% in volume to 41 million litres and increased by 2% in value to $152 million, supported by minor increase in the average unit value to $3.73/L. 36 Similar to bottled red wine exports, the US was the most valuable bottled white wine destination and exports increased by 4% to $116 million. Over 78% of all NSW bottle white wine exports were shipped to the US in 2021-22. 35
Macroeconomic Conditions
The total global area under vines for all purposes (wine, table grapes, raisins, and young vines not yet in production) was estimated at 7.3mha in 2021 137 and total global wine production for the 2021 calendar year fell 1% year-on-year to 260 million hectoliters. Production varied greatly by hemisphere. Southern hemisphere wine countries increased production by 23%, whereas Northern hemisphere wine countries recorded sharp declines in production in response to unfavourable climatic conditions. notably in Italy, Spain and France. 137 Global consumption indicated partial recovery from the impacts of the COVID pandemic, increasing 1% compared to 2020 which recorded the lowest level of annual consumption since 2002.
Outlook
Stronger Primary Industries Strategy
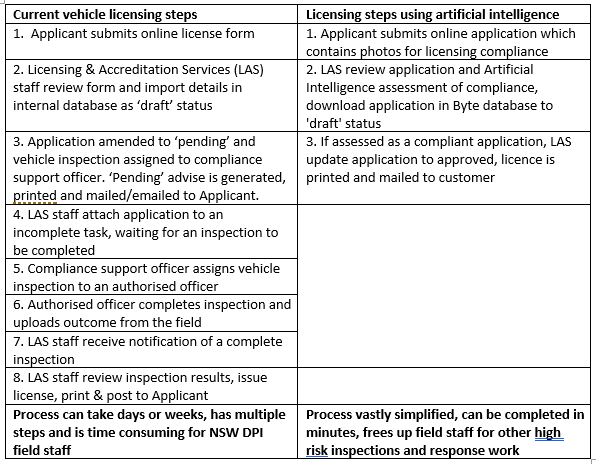
Development of an artificial intelligence-based tool for licensing of facilities and equipment
An expanding regulatory remit, and increased response to biosecurity emergencies and natural disasters necessitates the need for additional regulatory tools. Similarly, many licensees regulated by NSW DPI are facing unprecedented cost and resource burdens that reduce their availability for physical inspections of facilities and equipment. To address these resource constraints, NSW DPI is investing in digital tools to automate processes for some licensing and compliance functions, particularly those that involve low-risk, high volume activity.
Strategic Outcome


Photos must show the general hygiene of the vehicle, intact refrigeration seals, digital temperature display, and registration plates. Machine learning allows the AI tool to determine if the photos show that the vehicle is compliant, vastly simplifying the current licensing process that can take several days or weeks. A comparison of the current and AI-based process is shown in the table below.
Use of the AI tool will save an estimated $120,000 in salaries per year, and over 1,000 hours in the field for compliance staff that can be utilised elsewhere. Vehicle owners will no longer need to have unnecessary time off the road and receive their license in a matter of minutes.