

Fisheries
- GVP $217 million est. Up 9% year-on-year.
- Rising demand for seafood products and rising input costs have resulted in price rises.
- China overtook Japan as NSW most valuable export market.
Wild Harvest
- Abalone Fishery - abalone are harvested from rocky reefs
- Estuary General Fishery - this fishery operates in the estuarine systems in NSW
- Estuary Prawn Trawl Fishery - the fishery mostly catches school prawns in the Clarence, Hawkesbury and Hunter rivers
- Lobster Fishery - fishers use traps to catch the lobsters from rocky reefs
- Ocean Hauling Fishery - this fishery targets finfish species including sardines, Sea Mullet, Australian Salmon, Blue Mackerel, Yellowtail Scad and Yellowfin Bream
- Ocean Trawl Fishery - there are two sectors in this fishery: prawn and fish trawl where both use trawl nets in the open ocean
- Ocean Trap and Line Fishery - this fishery uses a variety of traps or lines with hooks from rocky reefs
- Sea Urchin and Turban Shell Restricted Fishery - sea urchins and turban shells are harvested from rocky reefs.
The wild harvest sector GVP value was $107 million in 2021-22, an increase of 7.3% year-on-year. Prices for salmonid and wild-caught prawn product increased, driven largely by rising food service demand and higher international prices. 59 In 2021-22, the wild harvest sectors contributed 50% to total fisheries GVP.
NSW fisheries are managed via limits on the allowable catch (maximum amount of a particular species that can be taken by commercial fishers) or effort (maximum amount of fishing effort (e.g. days) that can be used by commercial fishers). These controls ensure the long-term viability and sustainability of the NSW commercial fishing industry.
Commercial Wild Harvest Volume and Value 175
- Estuary General
- Estuary Prawn Trawl
- Inland
- Ocean Hauling
- Ocean Trap & Line
- Ocean Trawl
- Southern Fish Trawl
- Abalone
- Sea Urchin & Turban Shell
- Lobster
- s37 Permit
- Total GVP (RHS)
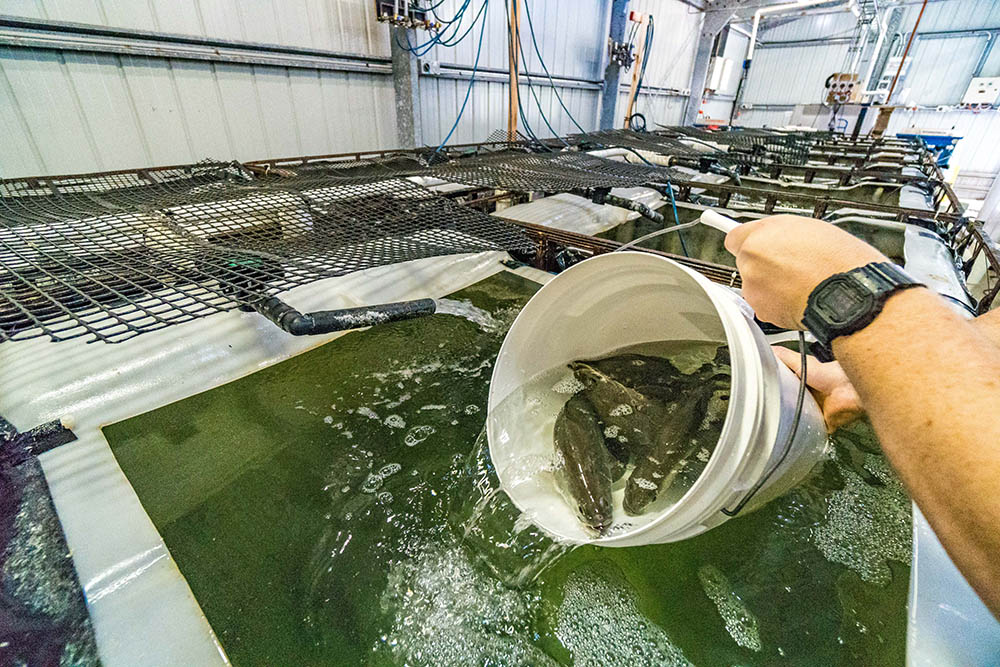
Aquaculture
Despite a fall in average price, Crustaceans were the standout growth commodity, led by Black Tiger Prawns. A total of 724 thousand kilograms of Black Tiger Prawns were produced in 2020-21, up 46% by volume year-on-year. 67 For freshwater fish, Murray Cod also continued several years of strong growth, up by 17% year-on-year to reach 492 thousand kg. The average price per kilogram for Murray Cod also increased by 9% year-on-year contributing to a total product value of $9.6 million. Rainbow Trout production increased by 39% but average prices softened by 14%. 67
Sydney Rock Oyster Production by estuary and year 67 ac
- 2018-19
- 2019-20
- 2020-21
Trade
Whilst this boom in exports is impressive, NSW does not produce farmed Atlantic Salmon and whilst some salmon is supplied by wild harvest, this is typically the Eastern Australian Salmon species which is unrelated to Atlantic Salmon. The vast majority of Atlantic Salmon supply in Australia is sourced from Tasmania, where it is farmed in large numbers in sea cages. Consequently, the significant increase in salmon exports from NSW was likely not NSW product but Tasmanian-produced product which was exported out of NSW ports due to COVID-related supply-chain challenges.
Fresh, chilled seafood exports are time-critical products, with a large proportion airfreighted to the required market. Typically, Australian seafood exports are carried in the cargo hold of commercial aircraft. Between 2014-2019, 76% of the total value of exported Australian seafood was exported by air, accounting for 26% of total value of air-freighted product, much of which was live product. 69 With few international passenger flights under COVID-19 restrictions, the majority of outbound flights were cancelled, and key transport routes disappeared.
The US was the second largest market for NSW fisheries, growing 16% in value year-on-year to $6.7 million. Japan, previously NSW fisheries most valuable market, declined in value by 54%, driven by a 66% fall in fresh and chilled fish exports, predominantly tuna. 35
Australia is generally an exporter of higher value seafood products and an importer of lower value seafood. NSW is a net importer of seafood, with a massive net trade balance of $820 million of seafood imported in 2021-22, indicating the level of domestic demand for seafood. The major import origins were Vietnam, Thailand, China, and New Zealand although there were many other key import markets. Prawns, preserved Tunas, Mussels, Fish and Fish fillets are some of the key import commodities. 35
Macroeconomic conditions
In addition to the impacts on production, harvest areas can be temporarily closed for harvesting due to the impact of high rainfall and flooding. A closure means no sales, no income; but farmers still need to maintain their stock and infrastructure. During the 2 years spanning 2020-21 and 2021-22, there were multiple periods where 100% of the state was closed for harvesting due to rainfall and flooding. Both 2020-21 and 2021-22 had more closures than any other year on record with numerous estuaries experiencing very long closures. The combined number of closure days for NSW estuaries over the two years spanning 2020-21 and 2021-22 was 20,512, a dramatic increase when compared to the 9,273 closure days over the two years spanning 2018-19 and 2019-20. 66
Global seafood demand rebounded strongly post-COVID-19, driven by growing demand for high value seafood in the US, EU and China. 49 Seafood is the most traded animal protein and in 2021, the global seafood trade was roughly 3.6 times the size of the global beef trade and five times the size of the global pork trade. 49 54% of the seafood consumed worldwide is produced through aquaculture, making it one of the fastest-growing industries in the world. Global aquaculture production was worth $USD260 billion in 2019. 60
Stronger Primary Industries Strategy
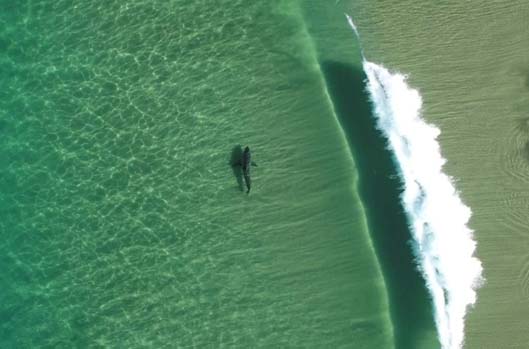
NSW Shark Management Program
The NSW Government committed $21.4 million in September 2021 to continue and expand its effective, evidence-based shark mitigation program for 2021/22 and beyond. Major milestones have seen the significant expansion of the deployment of SMART drumlines and tagged shark listening stations statewide.
Strategic Outcome

The deployment of an additional 16 new tagged shark listening stations (VR4Gs) to complement the current 21 is almost complete and will result in every coastal local government area having at least one listening station. Thirty-seven shark listening stations will detect and report via the Sharksmart App and Twitter feed the movements of tagged White, Tiger and Bull Sharks along the NSW coastline.
As of July 2022, DPI Fisheries is currently tracking over 1,250 target sharks (White, Tiger and Bull Sharks) as part of this program. DPI Fisheries will continue to tag and track target sharks to contribute to scientific knowledge of shark behaviours while using this real-time information to inform the public of shark movements as part of the larger shark mitigation program. With ongoing funding of more than $85 million to continue this program until 2026, the NSW Shark Management Program is the largest and most comprehensive in the world.
