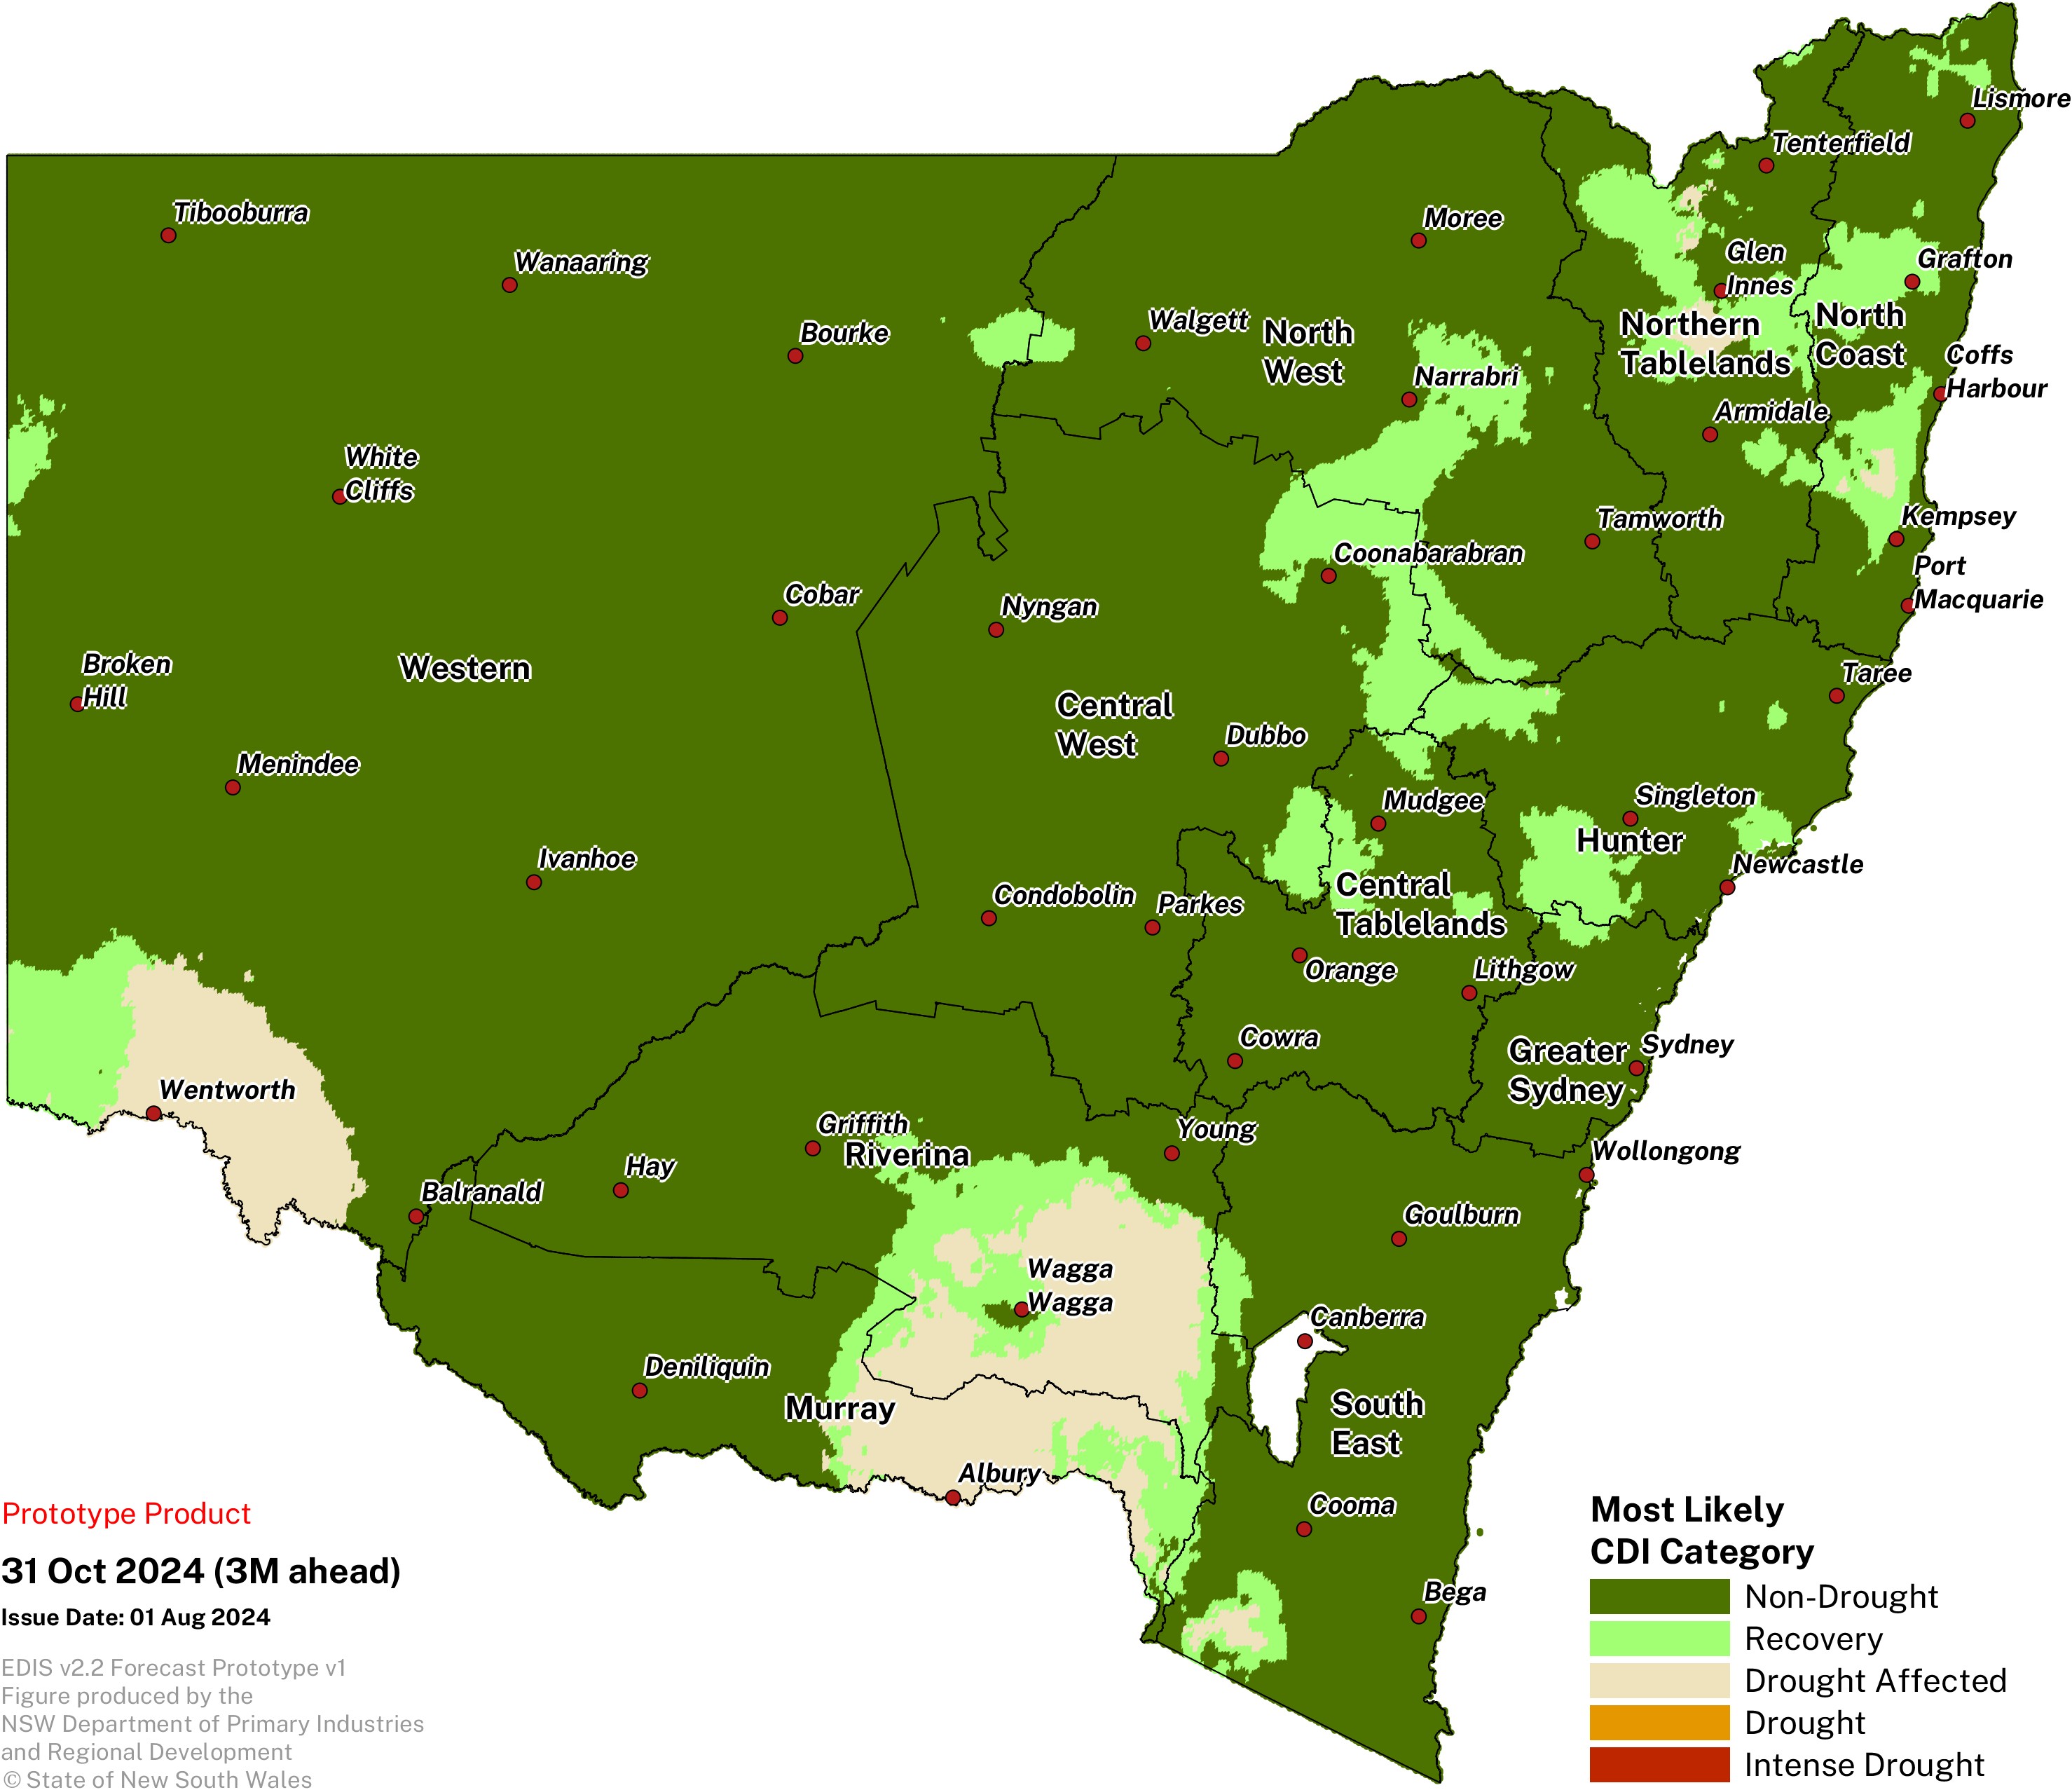
At the end of April 2025, up to 83% of the state is in the Non-Drought or Recovery categories of the long-term drought indicator (NSW Combined Drought Indicator).
Percentage area of NSW in each of the CDI categories
| CDI Category | March 2025 | April 2025 |
|---|---|---|
| Non-Drought | 79.0% | 77.0% |
| Recovering | 6.6% | 6.0% |
| Drought Affected | 13.8% | 15.7% |
| Drought | 0.3% | 1.3% |
| Intense Drought | 0.0% | 0.0% |
It is important to recognise the CDI provides an aggregated view of NSW, and that on-ground conditions can be different to those displayed in the maps. They provide a longer term ‘on average’ view of a particular region only.